

This GBP/USD trade journal covers my buy on July 28, 2026 during the out of session session. This GBP/USD buy lost, and the useful part of the review is why I took it. My journal says price moved higher and created a one-hour fair value gap. I entered when price tapped a 15-minute gap, aiming for a nearby bearish fair value gap above. But I also marked the trade as out of session and counter-trend. Those details deserve more attention than the fact that the target looked attractive.
The recorded entry was 1.32988, the stop was 1.32914, and the target and exit were 1.33211. I recorded a 1R loss. These are the completed trade facts; the later movement discussed below is a separate hindsight observation. I am sharing the original screenshots so the reasoning can be checked against the chart, while keeping the written journal as the source for what I actually decided.
Why I considered this GBP/USD setup
The one-hour gap gave me a bullish area to watch, and the 15-minute tap gave me an entry trigger. A fair value gap is an imbalance zone on the chart, not a promise of support. My mistake tags say I ignored the higher-timeframe context, traded in the wrong session and felt FOMO. In the lesson field I wrote that I should not try to predict the low of a bearish trend. That is a direct critique of the premise of this buy.
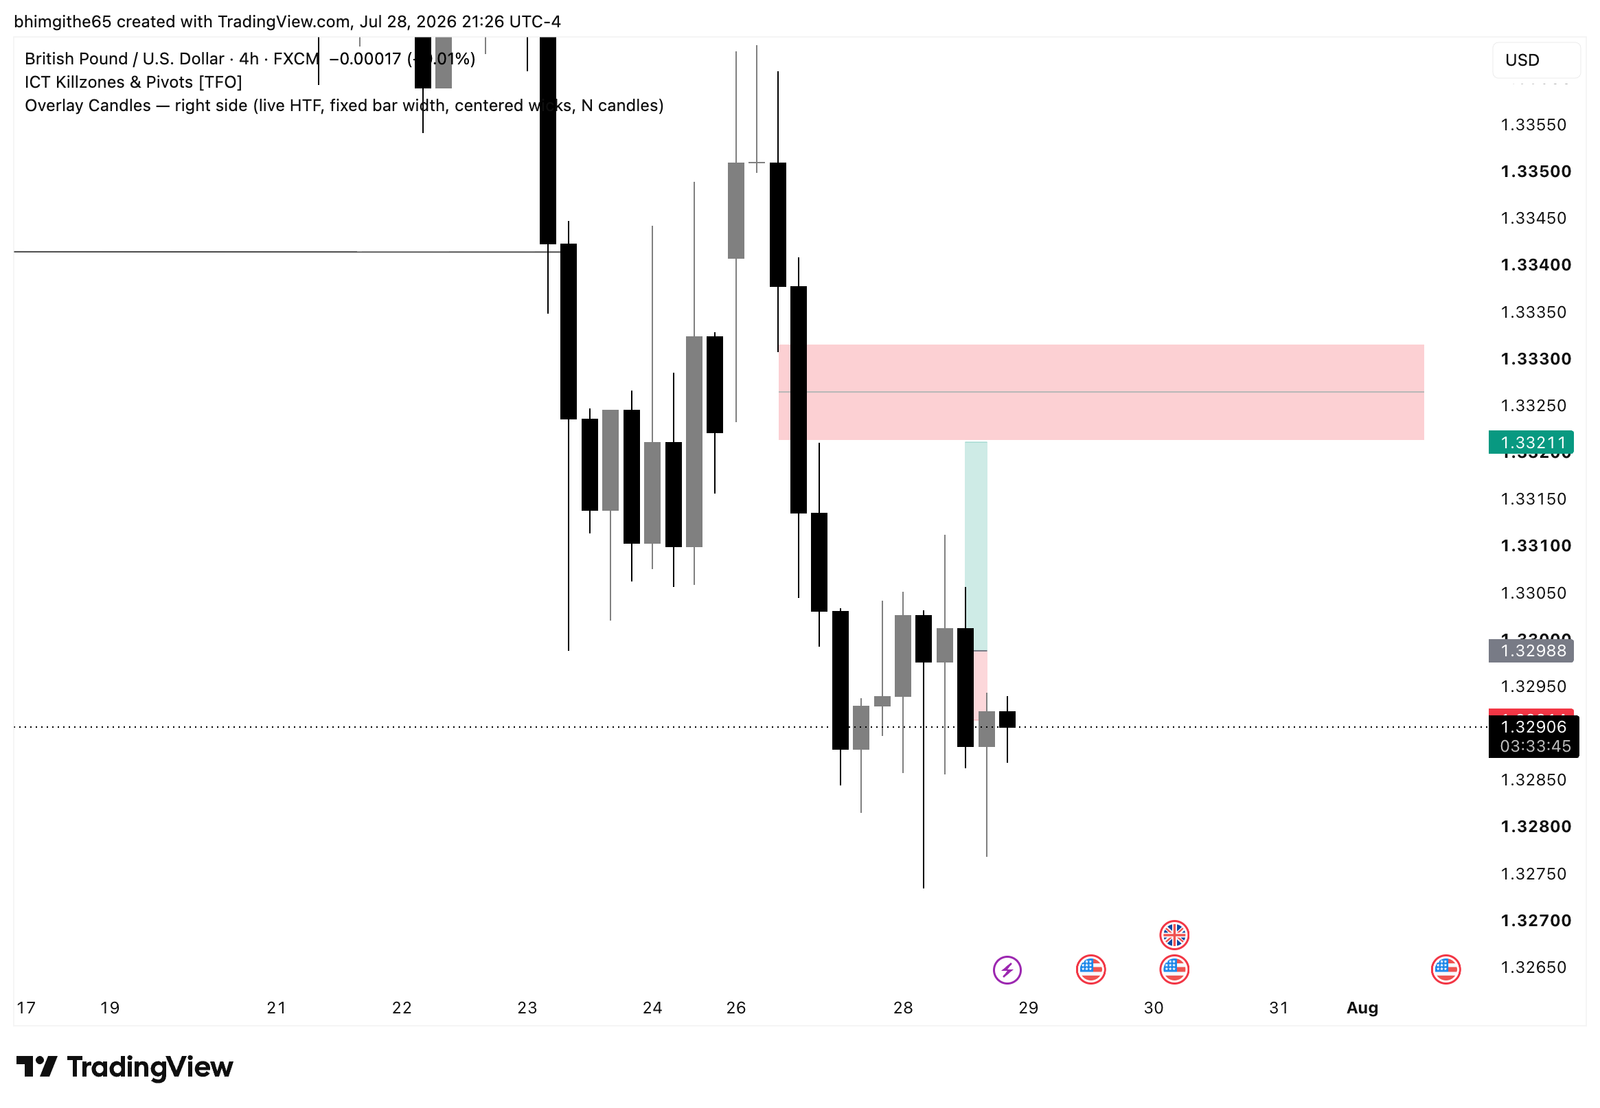
4-hour original chart: what it adds
The original four-hour TradingView screenshot is included here, unchanged. It is one of the three charts saved with this journal, not a generated market image. I use it to inspect the marked zones and the surrounding price action alongside my written notes. A screenshot saved after the event can show what happened around a level, but it cannot by itself prove exactly what I knew at entry or when I made each decision. The four-hour image helps me compare the buy against the broader bearish move.
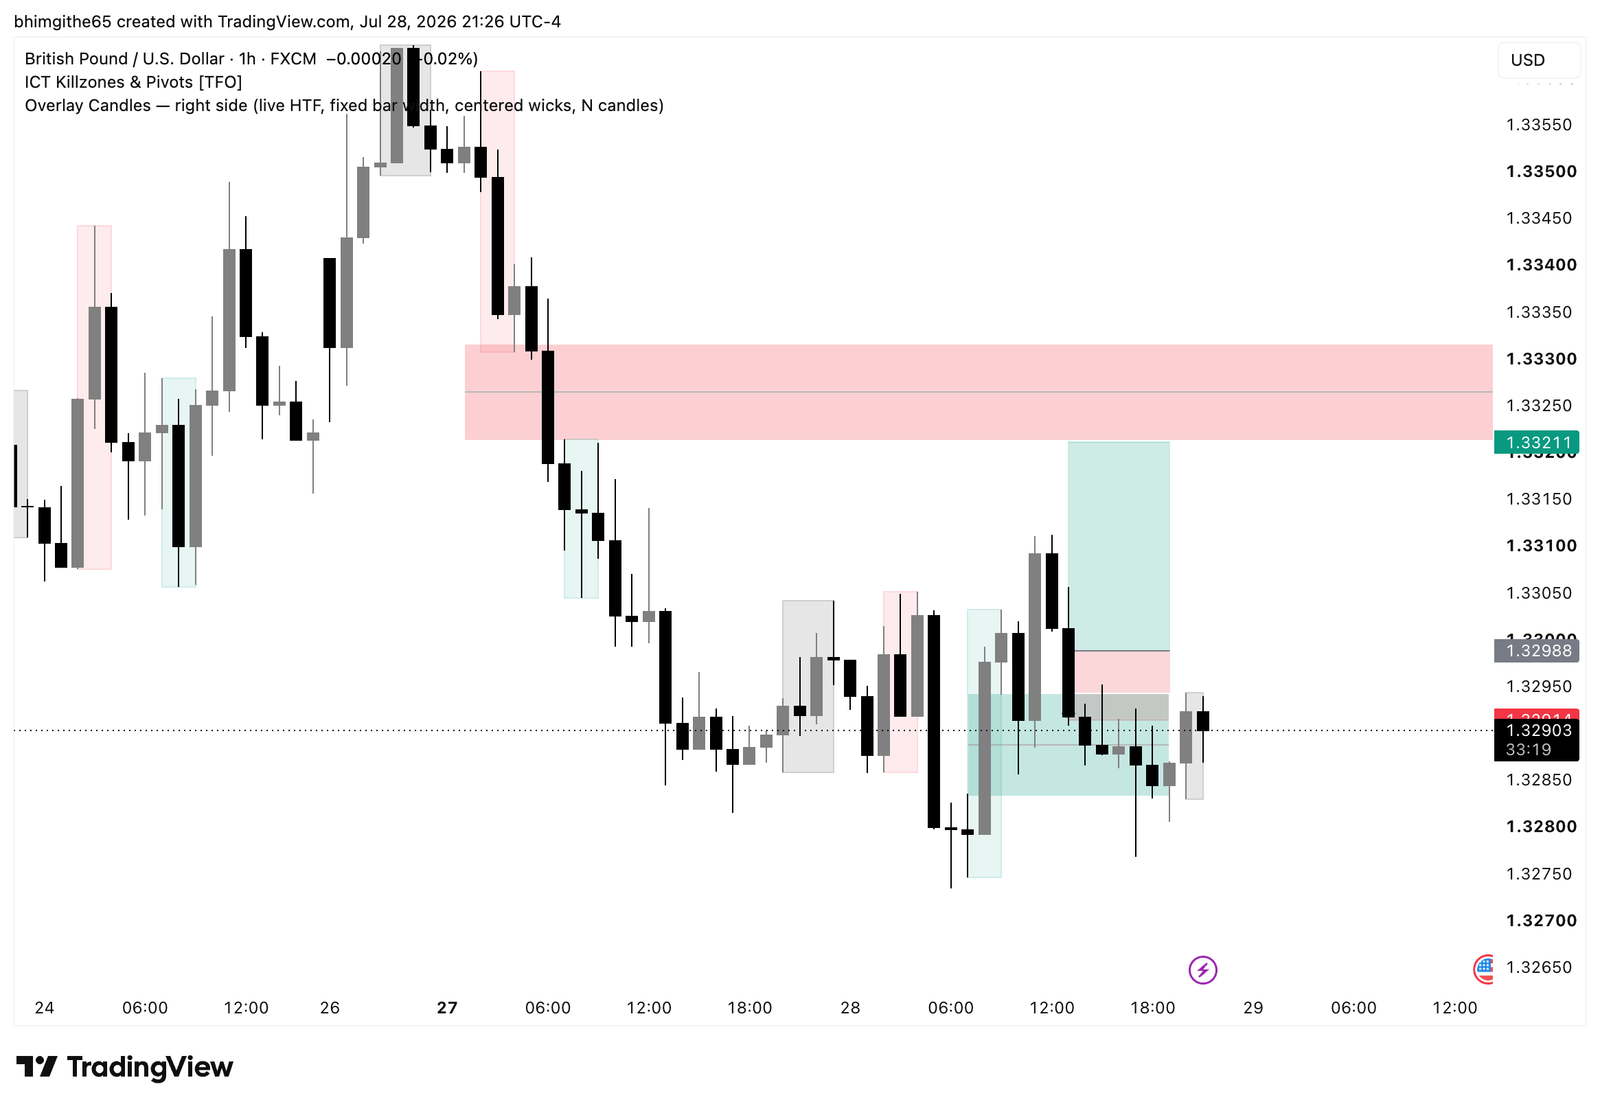
1-hour original chart: what it adds
The original one-hour TradingView screenshot is included here, unchanged. It is one of the three charts saved with this journal, not a generated market image. I use it to inspect the marked zones and the surrounding price action alongside my written notes. A screenshot saved after the event can show what happened around a level, but it cannot by itself prove exactly what I knew at entry or when I made each decision. The one-hour image contains the area I said price tapped.
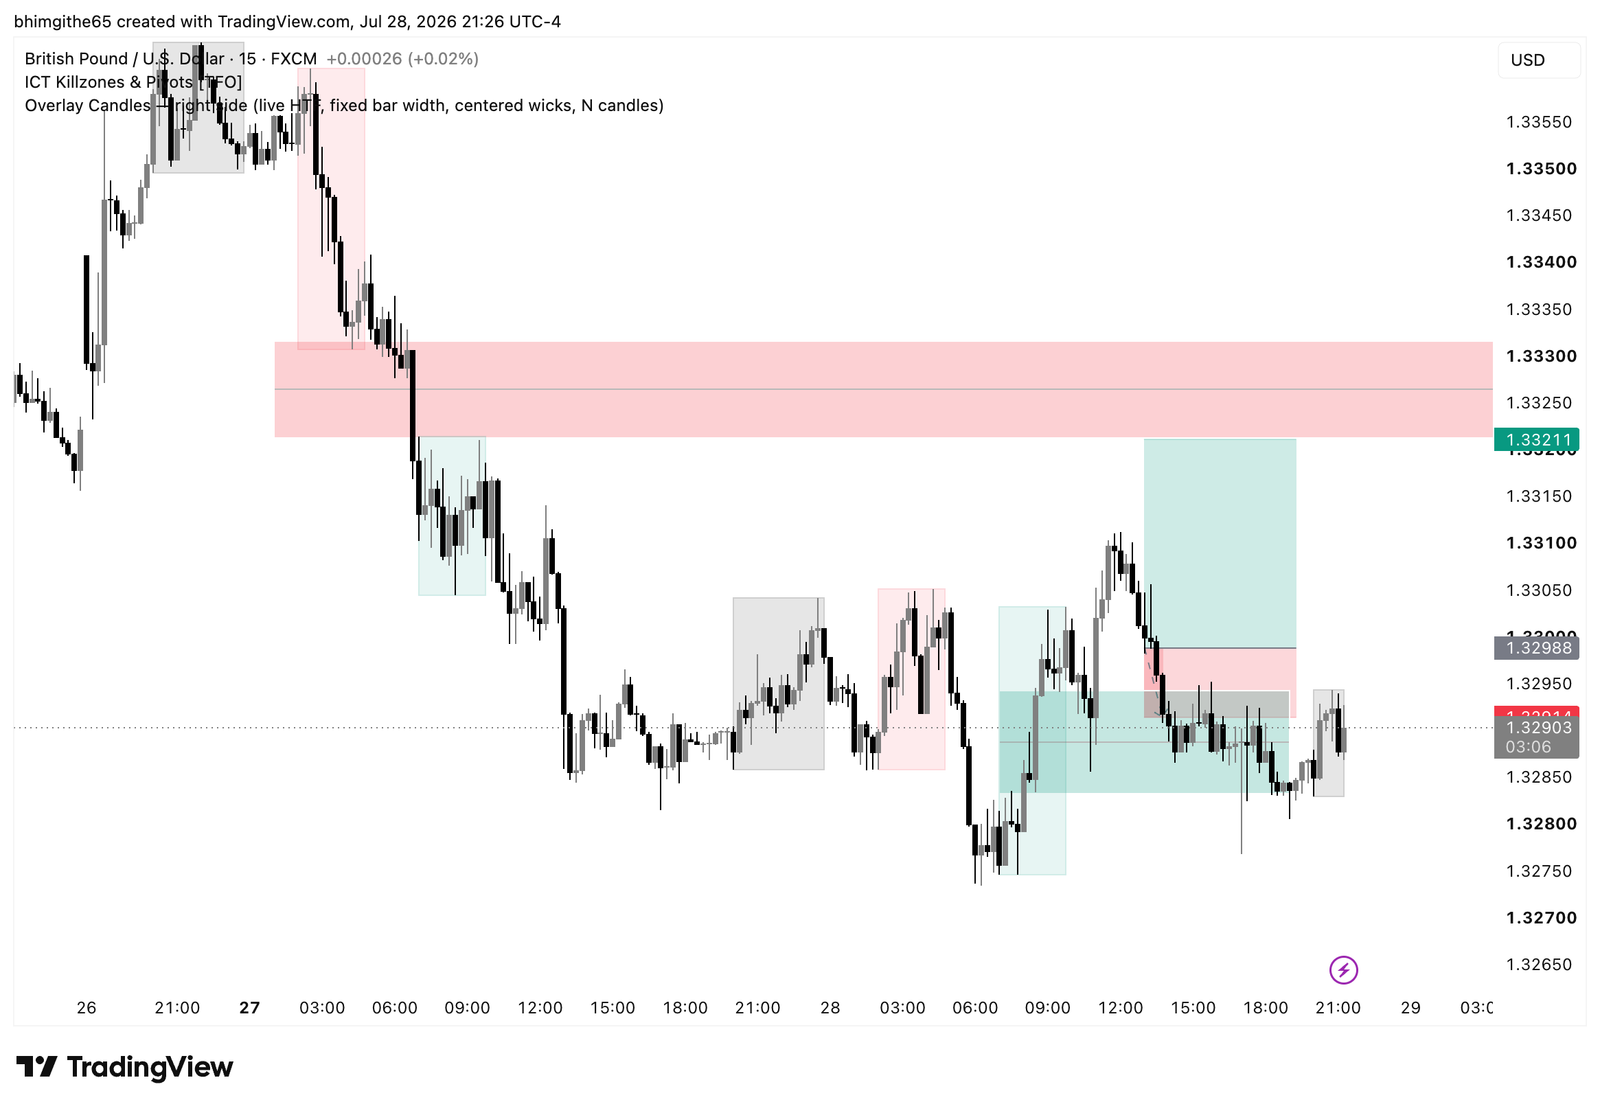
15-minute original chart: what it adds
The original 15-minute TradingView screenshot is included here, unchanged. It is one of the three charts saved with this journal, not a generated market image. I use it to inspect the marked zones and the surrounding price action alongside my written notes. A screenshot saved after the event can show what happened around a level, but it cannot by itself prove exactly what I knew at entry or when I made each decision. The 15-minute image gives the closer entry context without changing the recorded loss.
Entry, stop and the recorded result
The recorded buy entry was 1.32988, the stop was 1.32914, and the target was 1.33211. The exit field matches the stop at 1.32914. That is a 0.00074 move against the position, or 7.4 pips, and the journal records a loss of 1R. The planned target was 22.3 pips above entry, but it was not reached in this trade. I marked confidence before the entry and a neutral emotion afterward. The loss is not something to hide or retell as a near miss.
What happened afterward
I wrote that price moved a little higher and then continued lower toward the higher-timeframe direction. The sequence is consistent with the warning I gave myself: a small bounce into a lower-timeframe area was not enough to reverse the broader bearish context. The screenshots are retrospective, so I use them to compare the areas I marked with what happened next. I do not infer a precise missed exit or a new entry that I did not record.
The lesson I am keeping
My rule from this trade is to avoid trading after the killzone or after the session close, and not to predict a low against a bearish trend. Before a future counter-trend buy, I want to ask whether I am following a planned session and whether the higher-timeframe case has changed. If those answers are weak, a good-looking lower-timeframe gap is not enough. Writing the mistake tags beside the actual 1R loss turns this into a useful process review rather than just another red result.
For my next review, I want to keep the same distinction between setup, execution and result. The entry, stop and exit fields tell me what I actually did. The annotated chart shows the price path I can study later. The lesson field tells me what I wanted to change or repeat. Keeping those three records separate helps me notice a weak process even after a win and a useful decision even after a loss. This is one historical trade, not a prediction about what GBP/USD will do next.
Related reading: the free trading journal template I use to keep a consistent record.
This is a retrospective trading journal for education, not a trade recommendation. The featured cover is editorial artwork; the TradingView images are the original screenshots.