
This NDX100 trade journal is about a sell I took during the New York session on July 15, 2026. My reason was simple: I saw a market structure shift on the 15-minute chart, a fair value gap on that same timeframe, and a pullback into the area I was watching. I entered the sell at 29,680.0 and closed it at 29,521.8. The result recorded in my journal was a win of 158.2 points, with an actual reward-to-risk ratio of 2.01R.
The result was good, but the lesson I wrote was about patience: wait for a fair value gap or a swing high or low to be validated or invalidated. Do not enter early. That is the part of this trade I want to keep reviewing, because a profitable outcome alone does not explain whether the entry process was good.
The trade as I recorded it
My entry was 29,680.0, my stop loss was 29,758.6, and both my take-profit and exit fields were 29,521.8. That puts the stop 78.6 points above the entry and the recorded exit 158.2 points below it. Dividing those two distances gives approximately 2.01R, which agrees with the number in my journal. These are index price points; the journal template labels the field ‘Pips’, but I am describing the actual price difference here.
I marked the setup with three tags: 15 Min MSS, Pullback Entry, and FVG Retest. My emotion before the trade was neutral, and afterward I marked myself satisfied. I recorded no mistake tags. Those details give me a useful record of what I saw and how I felt without adding an explanation that I did not write at the time.
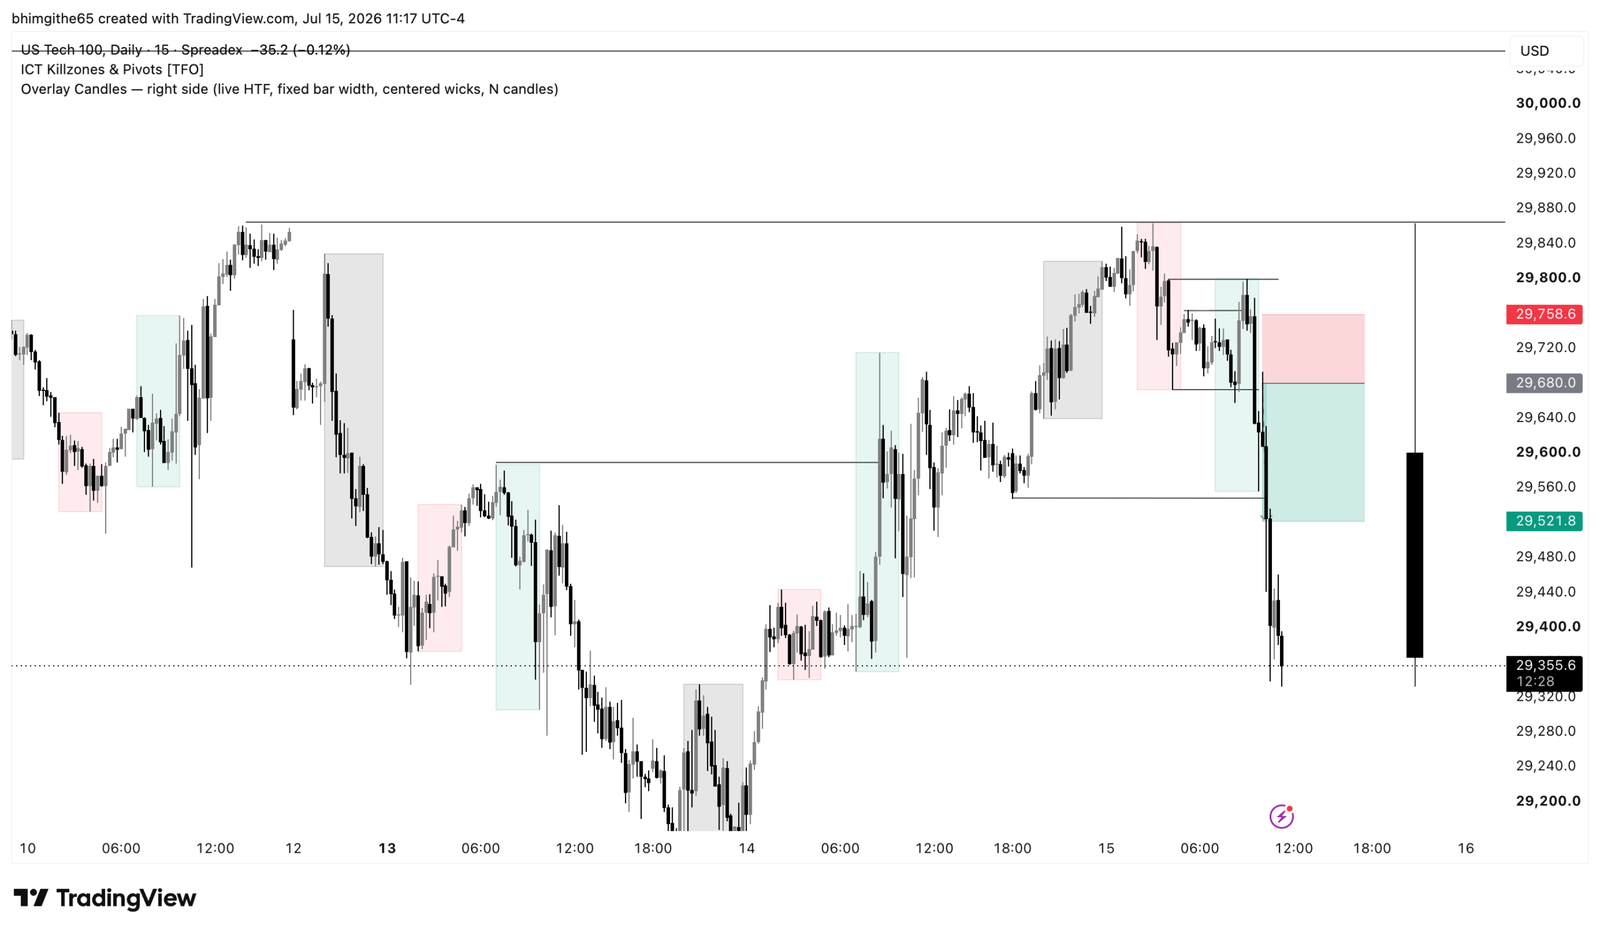
15-minute chart: the setup I was watching
The 15-minute chart was the basis of my written entry reason. I noted a market structure shift, or MSS, and a fair value gap, or FVG. I also referred to a fair value area in my notes. My description was that I entered in that area when price came into the fair value gap. The pullback and retest were therefore part of the setup I recorded, rather than a separate explanation added after seeing the result.
The first original screenshot shows the wider price sequence and the marked sell position, including the entry, stop, and target levels. It also shows that price eventually moved below the target. I can use this view to review the surrounding swings, but my notes do not provide a separate higher-timeframe bias or a news catalyst. I am keeping the explanation focused on the 15-minute setup that I actually documented.
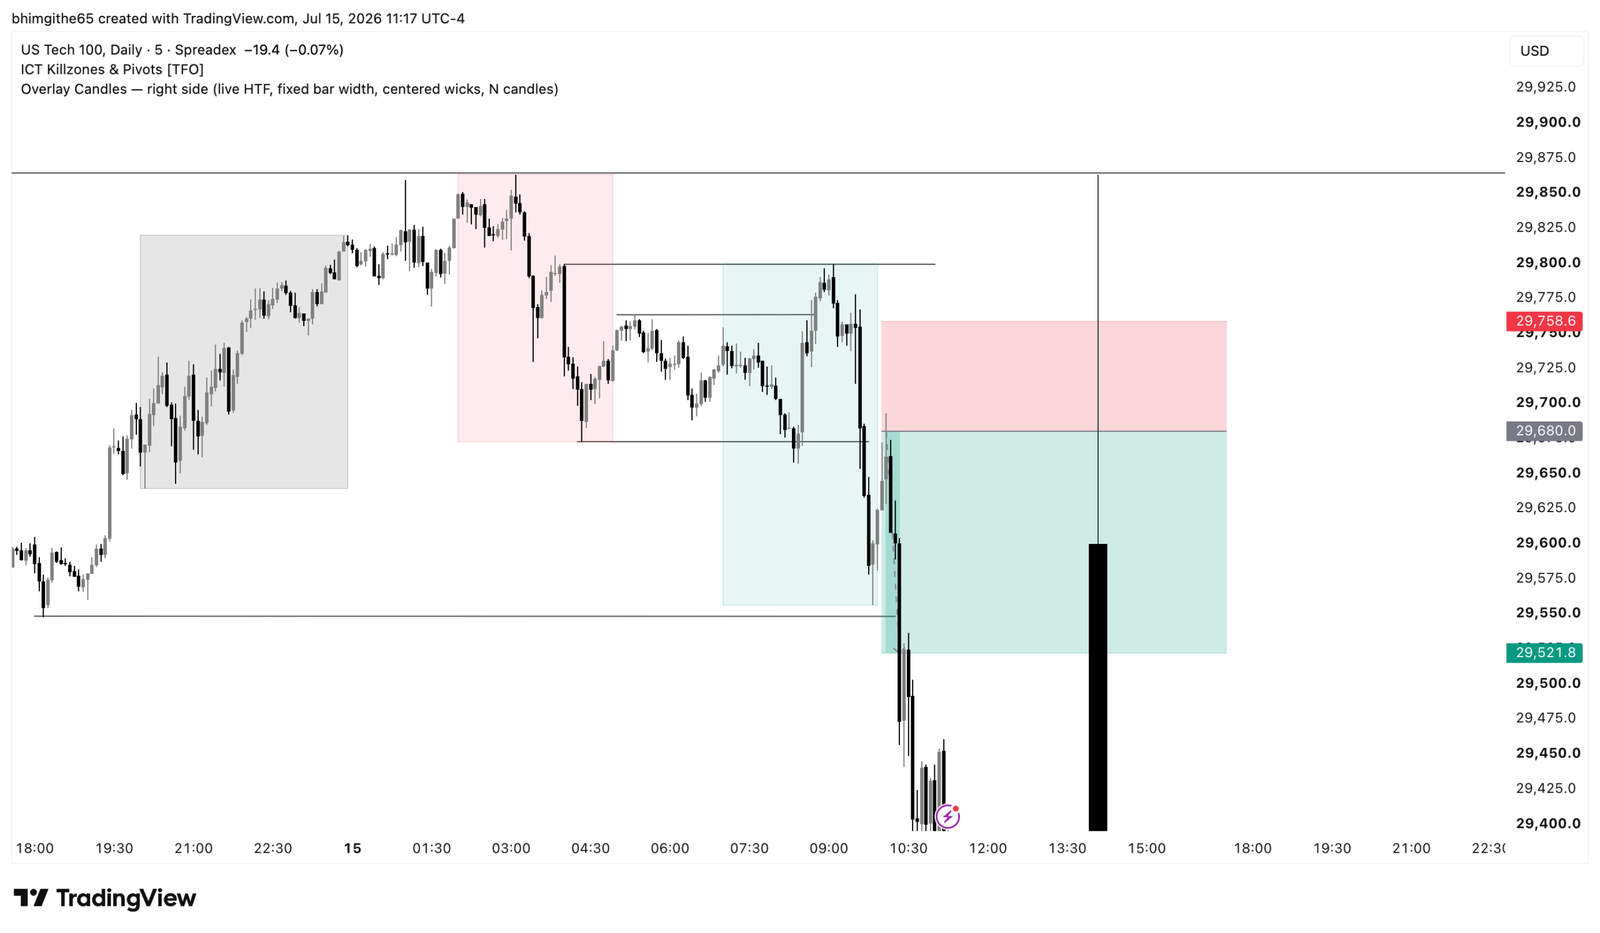
5-minute chart: a closer look at the move
The second screenshot is the 5-minute view. It gives a closer look at the price action around the same marked levels and the decline through the target area. Keeping it after the 15-minute screenshot makes the review easier to follow: first the setup view, then the more detailed view of the move.
I did not write that I required a separate 5-minute entry signal, so I am not treating this screenshot as proof of one. Both images were saved after the move had developed. They help me review the trade, but they do not justify inventing a precise entry time, an extra confirmation, or a decision about managing the position that is missing from the journal.
The result and what price did later
My recorded outcome was the exit at 29,521.8 and approximately 2.01R. In the ‘What Price Did Later’ field, I wrote that price went lower and that I would have reached 1:3 RR if I had set that target. That is a hindsight observation, not the return I actually recorded for this trade.
I want to keep those two things separate in the review. The completed trade has one result; the later movement is something I can study when thinking about target selection. A move continuing after my exit does not automatically mean the original target was a mistake. My journal records satisfaction after this trade and no mistake tags, alongside the observation that more downside followed.
The lesson I am carrying forward
The clearest lesson in my notes is to wait. Before entering, I want to see whether the fair value gap or the relevant swing is being respected or invalidated. Seeing an area on the chart is only the start of the review; the reaction around it is what I want to pay attention to. My own reminder was direct: do not enter early.
For this trade, the combination I documented was the 15-minute MSS, the pullback, and the FVG retest. The useful record is that sequence together with the actual entry, stop, exit, and emotions. When I compare it with later journal entries, I want to compare the process as well as the outcome. This was one winning trade, and the purpose of writing it down is to learn from that specific example.
Related reading: my EUR/USD trade journal on a rejection-candle break.
This is a retrospective trading journal, not a recommendation to enter a trade. The featured cover is AI-generated editorial artwork; the two TradingView charts are the original journal screenshots.