
This NDX100 trade journal reviews a counter-trend buy I took during the New York session on July 20, 2026. The higher timeframe was bearish, but the lower swing was trying to move upward. I entered at 28,865.3, used 28,772.9 as my stop, and planned to target 29,052.3. The trade reached the stop for a recorded loss of 92.4 index points, or minus 1R.
I marked myself confident before the trade and neutral afterward. My mistake tags were Forced Entry and Bias Flip. Those labels match the main conflict in the setup: I knew the larger direction was down, yet I tried to buy a lower-timeframe rise. The purpose of this review is to understand why that choice was lower quality than another setup I had available that day.
The plan and the conflict inside it
My reason began with a bearish higher-timeframe trend. I also saw what I described as a four-hour fair value gap rejecting on the one-hour chart. At the same time, the lower swing was moving upward, so I planned a counter-trend trade toward the next fair value gap above price. The trade therefore asked a smaller bullish move to work against a larger bearish background.
A counter-trend trade is not automatically wrong, but it needs a clear reason and careful confirmation because the larger directional pressure may return. In this case, my own notes show that I was balancing two opposing ideas. That should have made me more selective, especially because my planned buy target sat above the entry while the higher-timeframe direction still pointed down.
One-hour context: the larger bearish structure
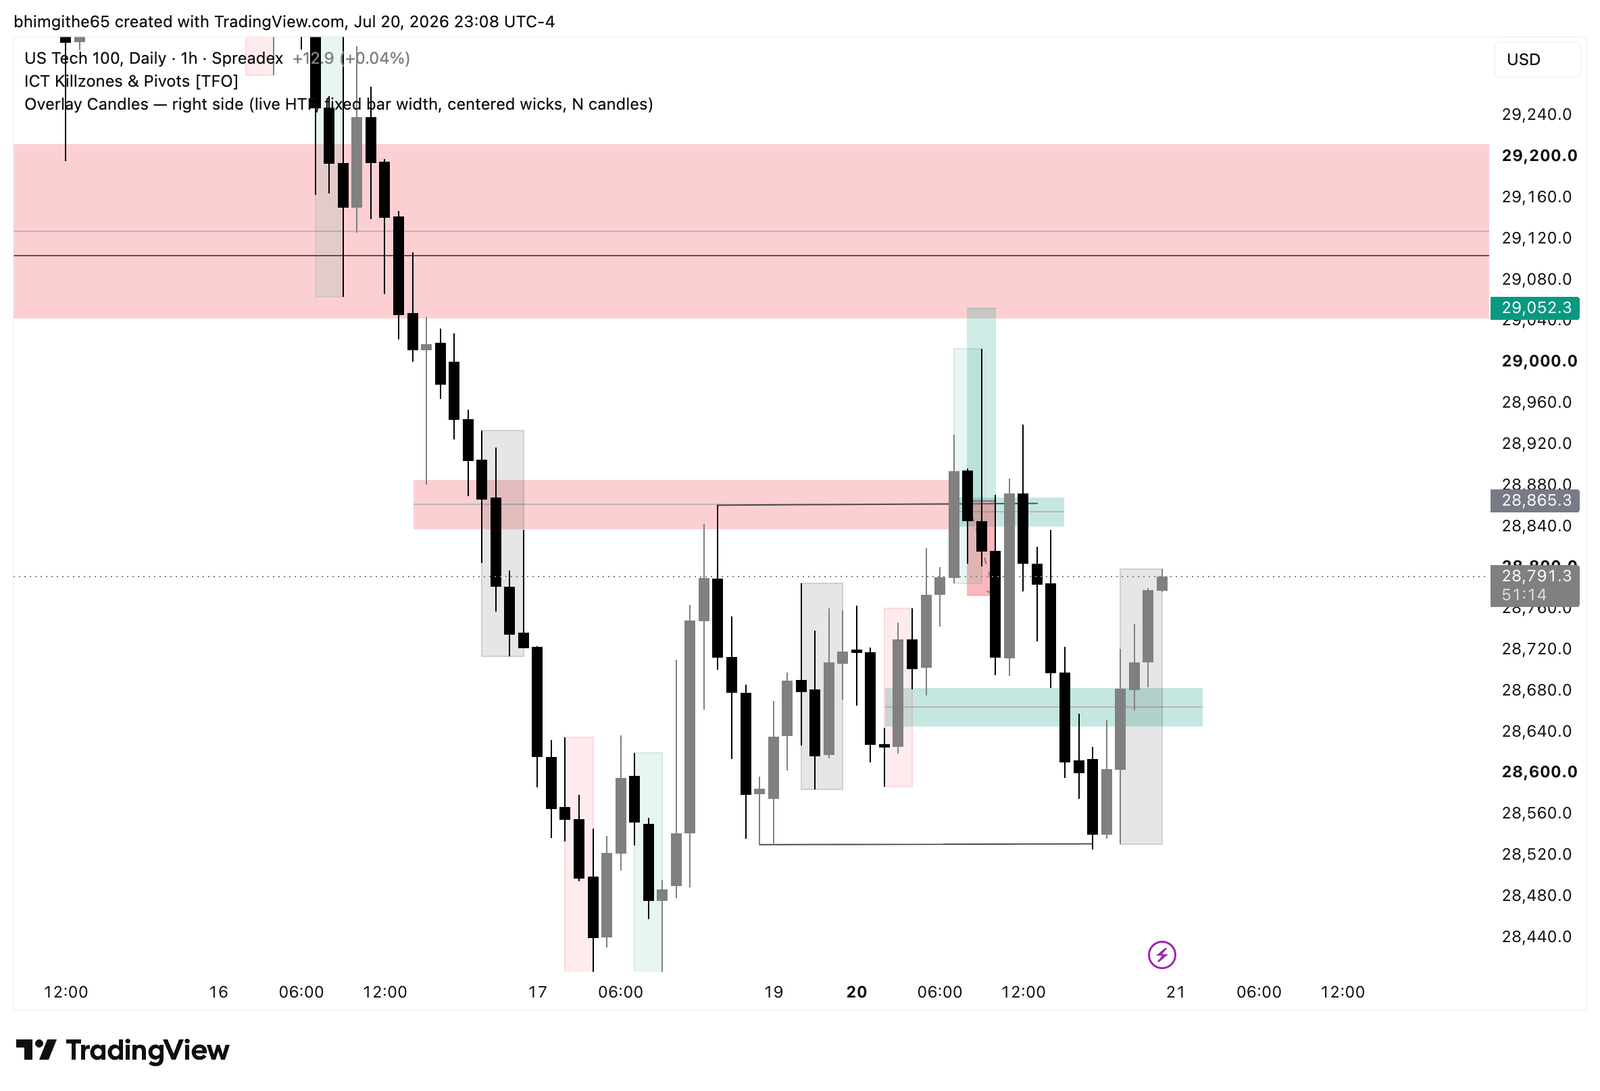
The one-hour screenshot gives the broadest saved view. It shows the earlier decline, the recovery into the area around my entry, and the later move lower. I did not attach a four-hour screenshot, so the four-hour fair value gap remains part of my written analysis rather than visible chart evidence in this post.
This view is useful because it keeps the lower-timeframe bounce in perspective. A rise on a smaller chart can look strong while still being only a retracement inside a broader bearish move. My error was not that I noticed the bounce. It was that I gave the counter-trend idea enough weight to trade even though I had already identified the higher-timeframe direction as bearish.
15-minute view: the rejection became clearer
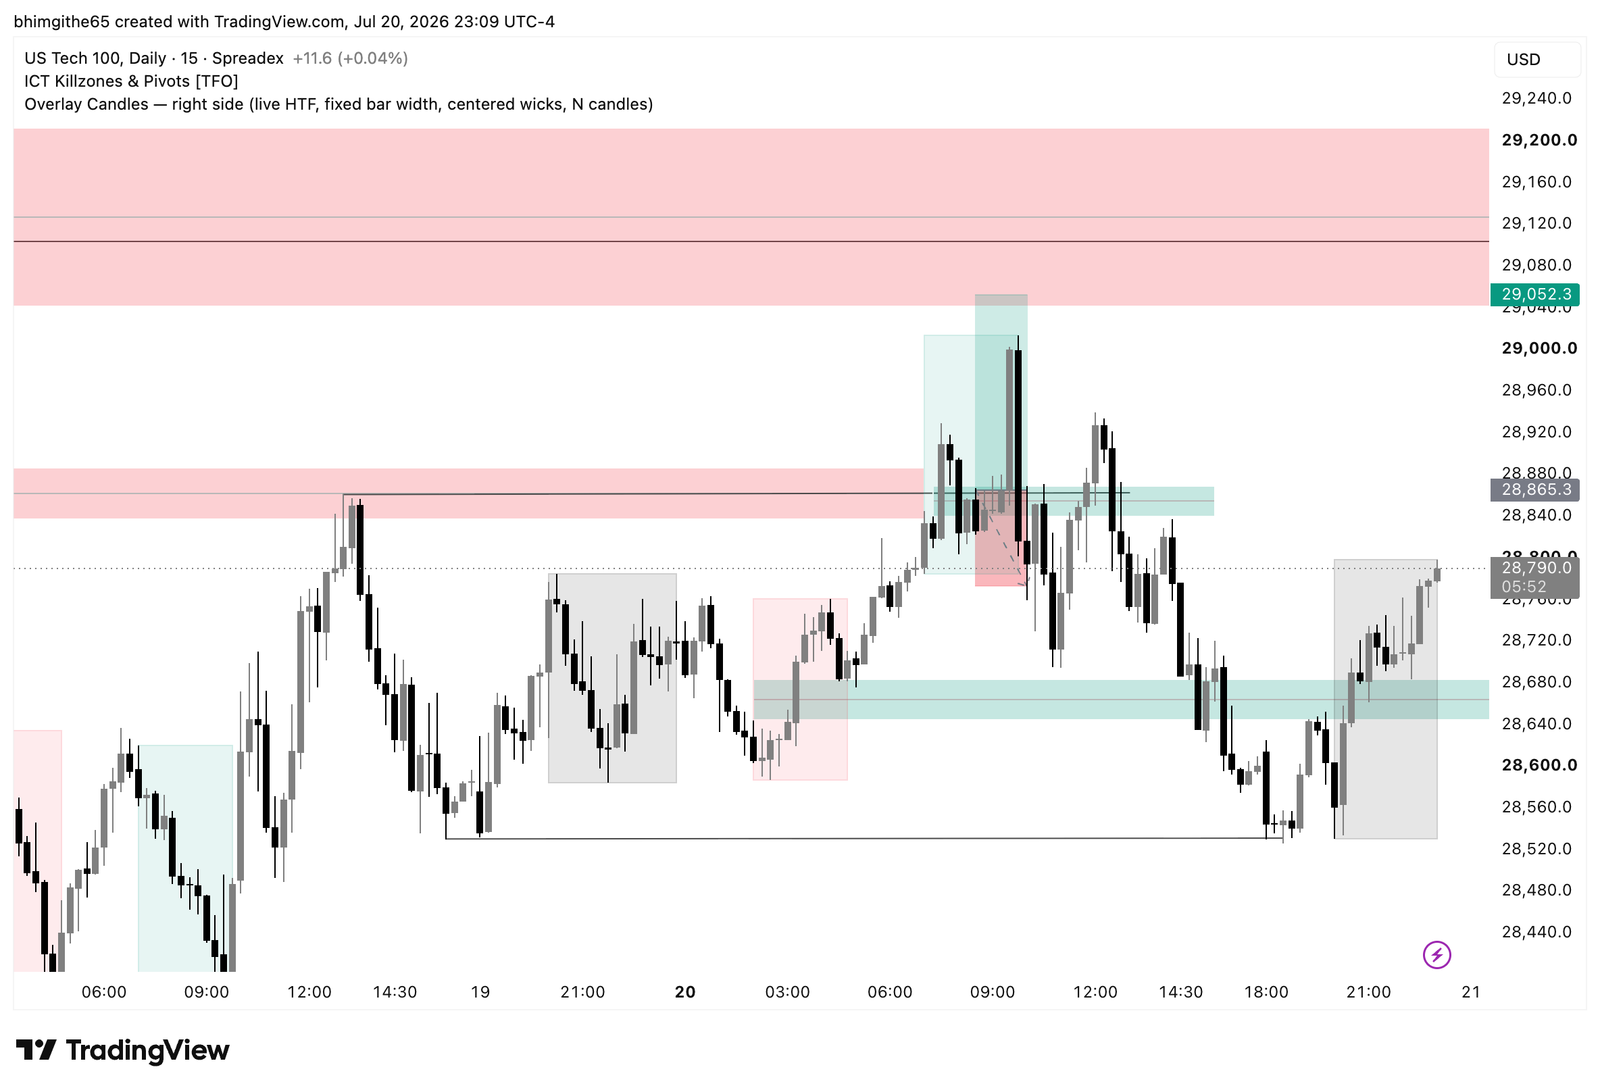
The 15-minute screenshot shows the marked long position around 28,865.3 and the reaction that followed. Price moved upward first, but the move did not reach the planned target. The chart then shows bearish pressure returning and carrying price through the stop area.
This is where I can review whether the lower-timeframe bullish idea had enough strength to justify fighting the broader direction. My journal does not record a clear bullish market structure shift or displacement as confirmation. Because that evidence is absent from the notes, I should not add it afterward simply because the chart contains a temporary rise.
Five-minute execution and the stopped trade
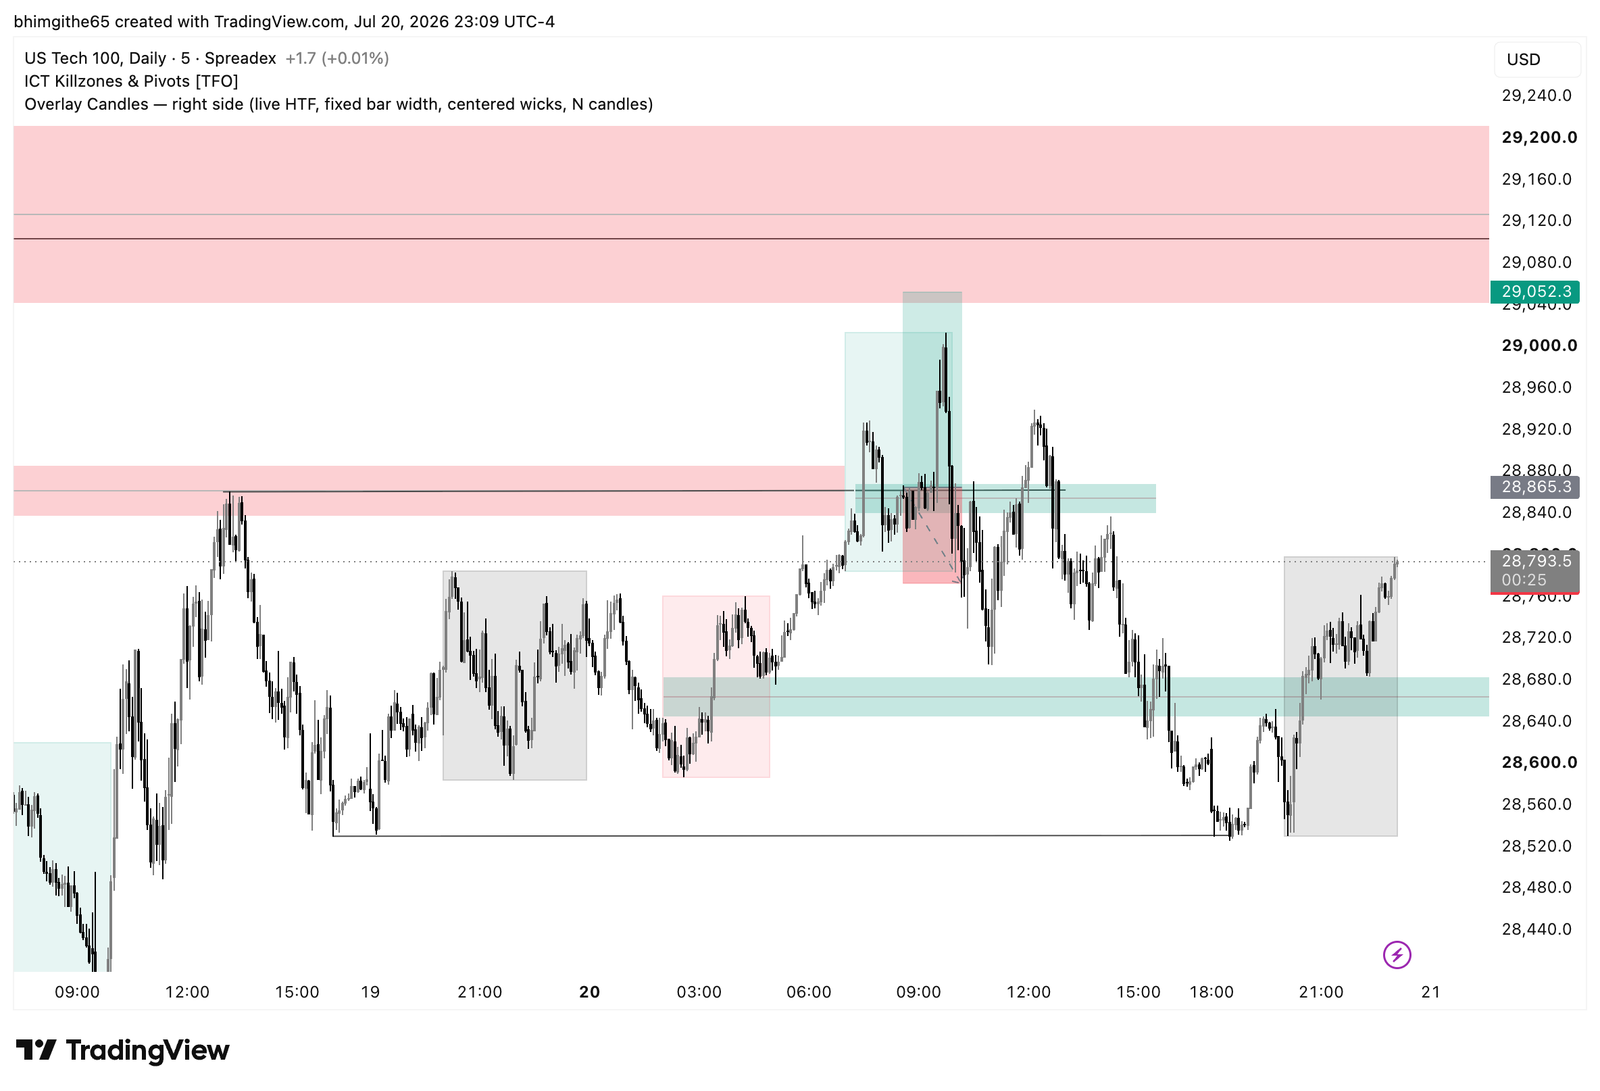
The five-minute screenshot provides the closest saved execution view. It preserves the entry, target, and stop zones and shows the short-lived rise followed by the decline. The actual result was the stop at 28,772.9, not the target at 29,052.3. That makes the completed outcome minus 1R.
My later-price note says price went lower and that a bearish trade aligned with the higher timeframe could have produced a profit. That is hindsight, so I cannot turn it into a trade I actually took. I can still use the observation to compare the direction I chose with the direction that was already supported by my broader analysis.
The stronger opportunity I passed over
My lesson mentions another EURUSD trade from the same day. I believed that setup had higher probability because both its higher and lower timeframes were bearish. By contrast, the NDX100 setup mixed a bearish higher timeframe with a bullish lower timeframe. Taking both ideas would have spread my attention, and choosing the counter-trend idea reduced the clarity of my decision.
The practical lesson is to rank the available setups before entering. When one trade aligns across timeframes and another depends on a counter-trend move, I want to give priority to the clearer setup. That does not guarantee a win, but it keeps my selection connected to the evidence I trust most.
What I want to change next time
This loss was not only about the stop being hit. My journal records a forced entry and a bias flip, which tells me the decision process needs improvement. Before taking another counter-trend setup, I want a specific confirmation rule and a reason strong enough to outweigh the higher-timeframe trend. If that evidence is missing, waiting is a valid decision.
The main lesson from this NDX100 trade journal is to avoid forcing a second idea when a cleaner opportunity is already present. I want confidence to come from alignment and confirmation, not from the hope that a lower-timeframe swing will continue. This one trade ended at minus 1R, but recording the conflict clearly can help me make a more disciplined choice next time.
Related reading: my earlier NDX100 journal about waiting for lower-timeframe confirmation.
This is a retrospective trading journal, not a recommendation to enter a trade. The featured cover is AI-generated editorial artwork; the 3 TradingView charts are the original journal screenshots.