

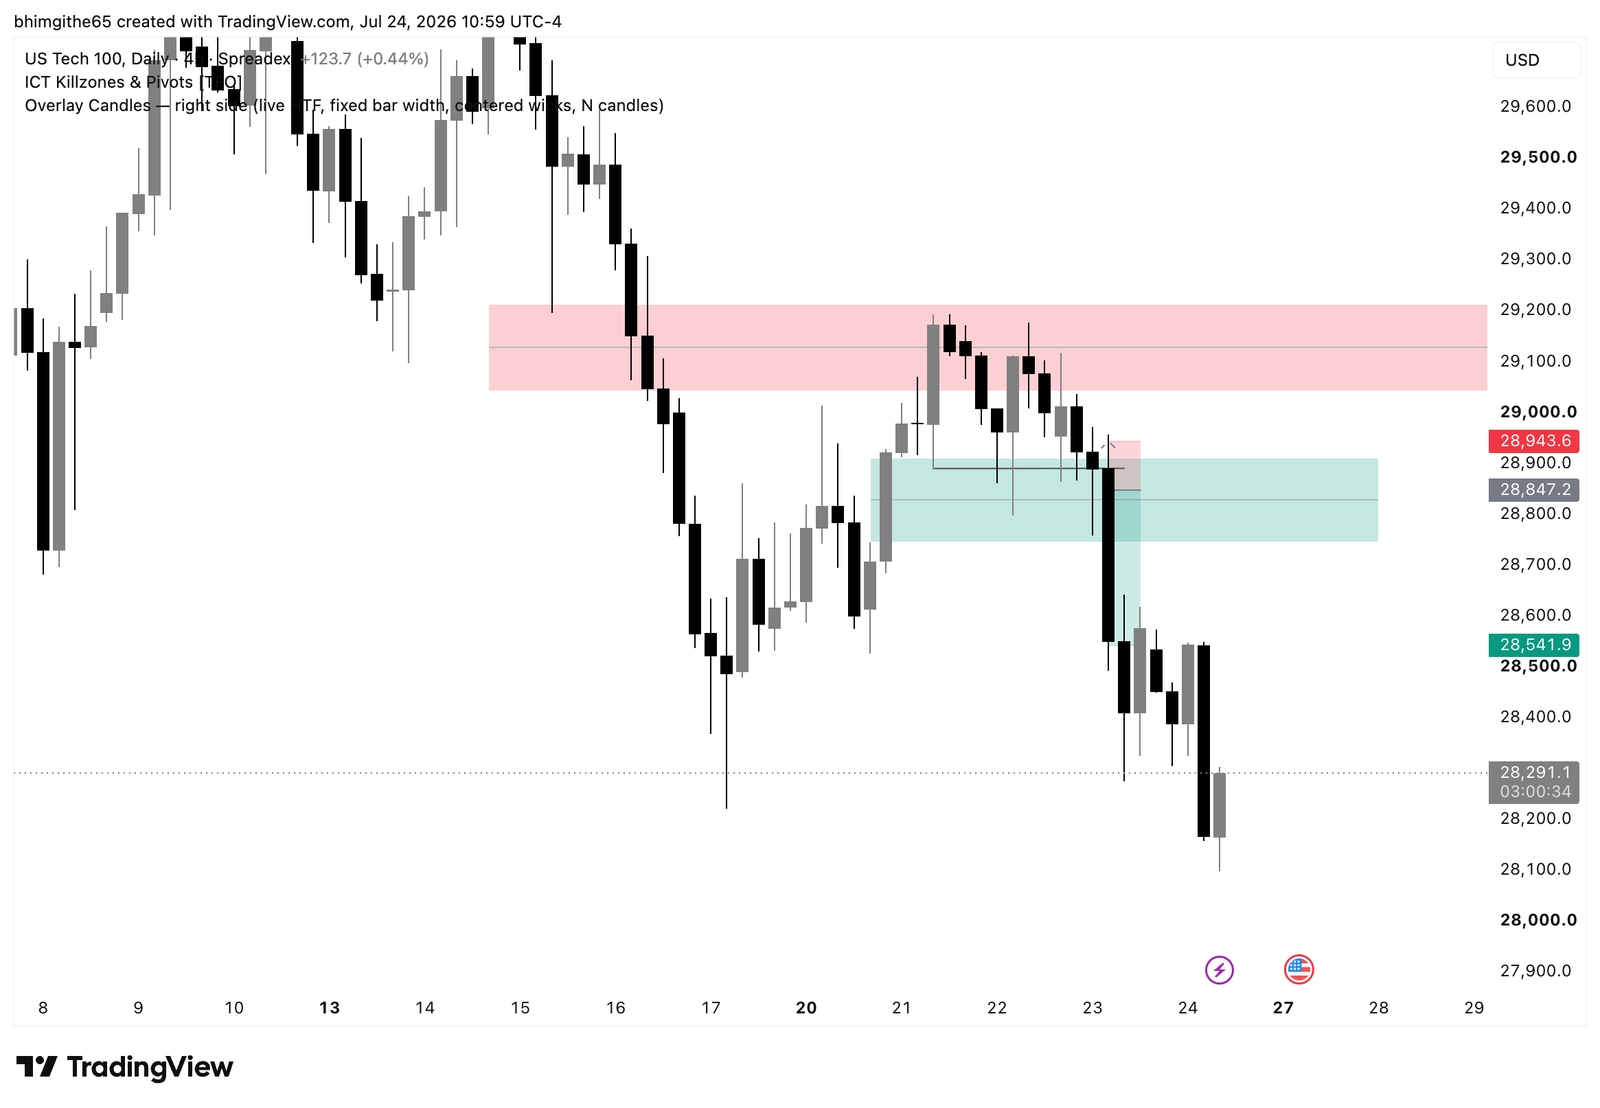
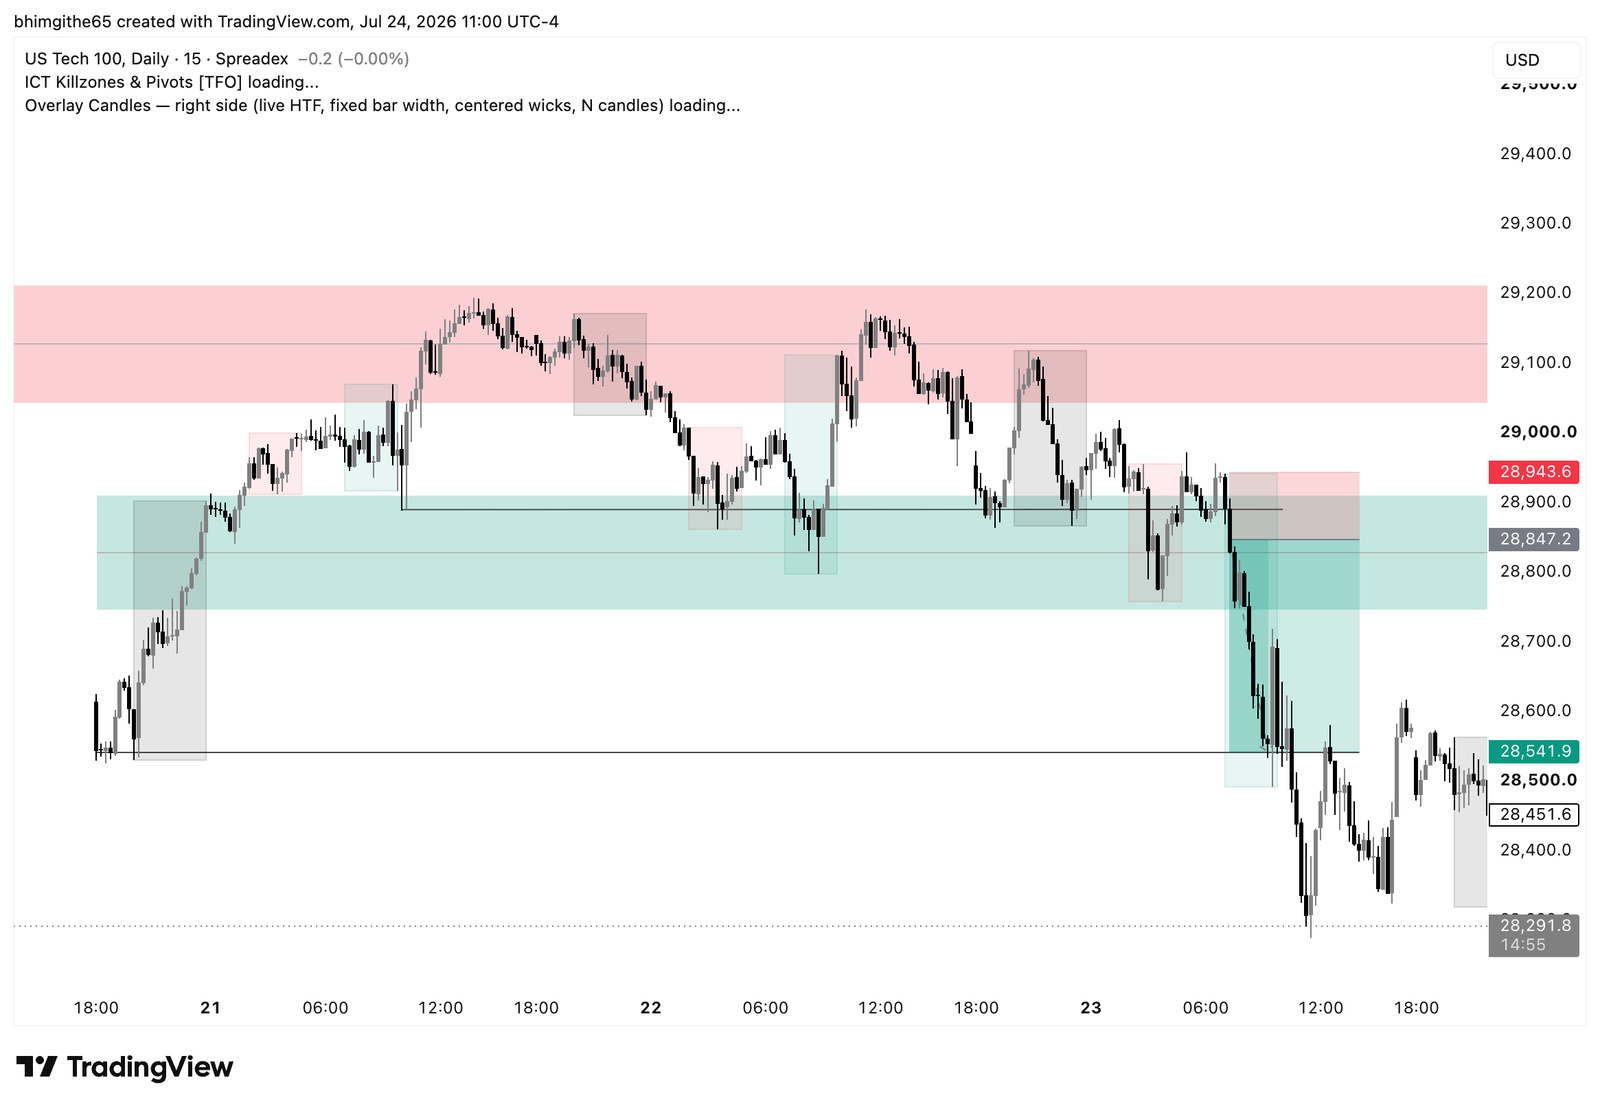
This NDX100 trade journal covers my sell on July 23, 2026 during the New York session. I did not see a clean path immediately. A daily bearish fair value gap was pushing price lower, but a four-hour bullish gap was also in the picture. That made the market look conflicted to me. My note says I waited until price rejected the bullish area and the 15-minute structure shifted before taking the short.
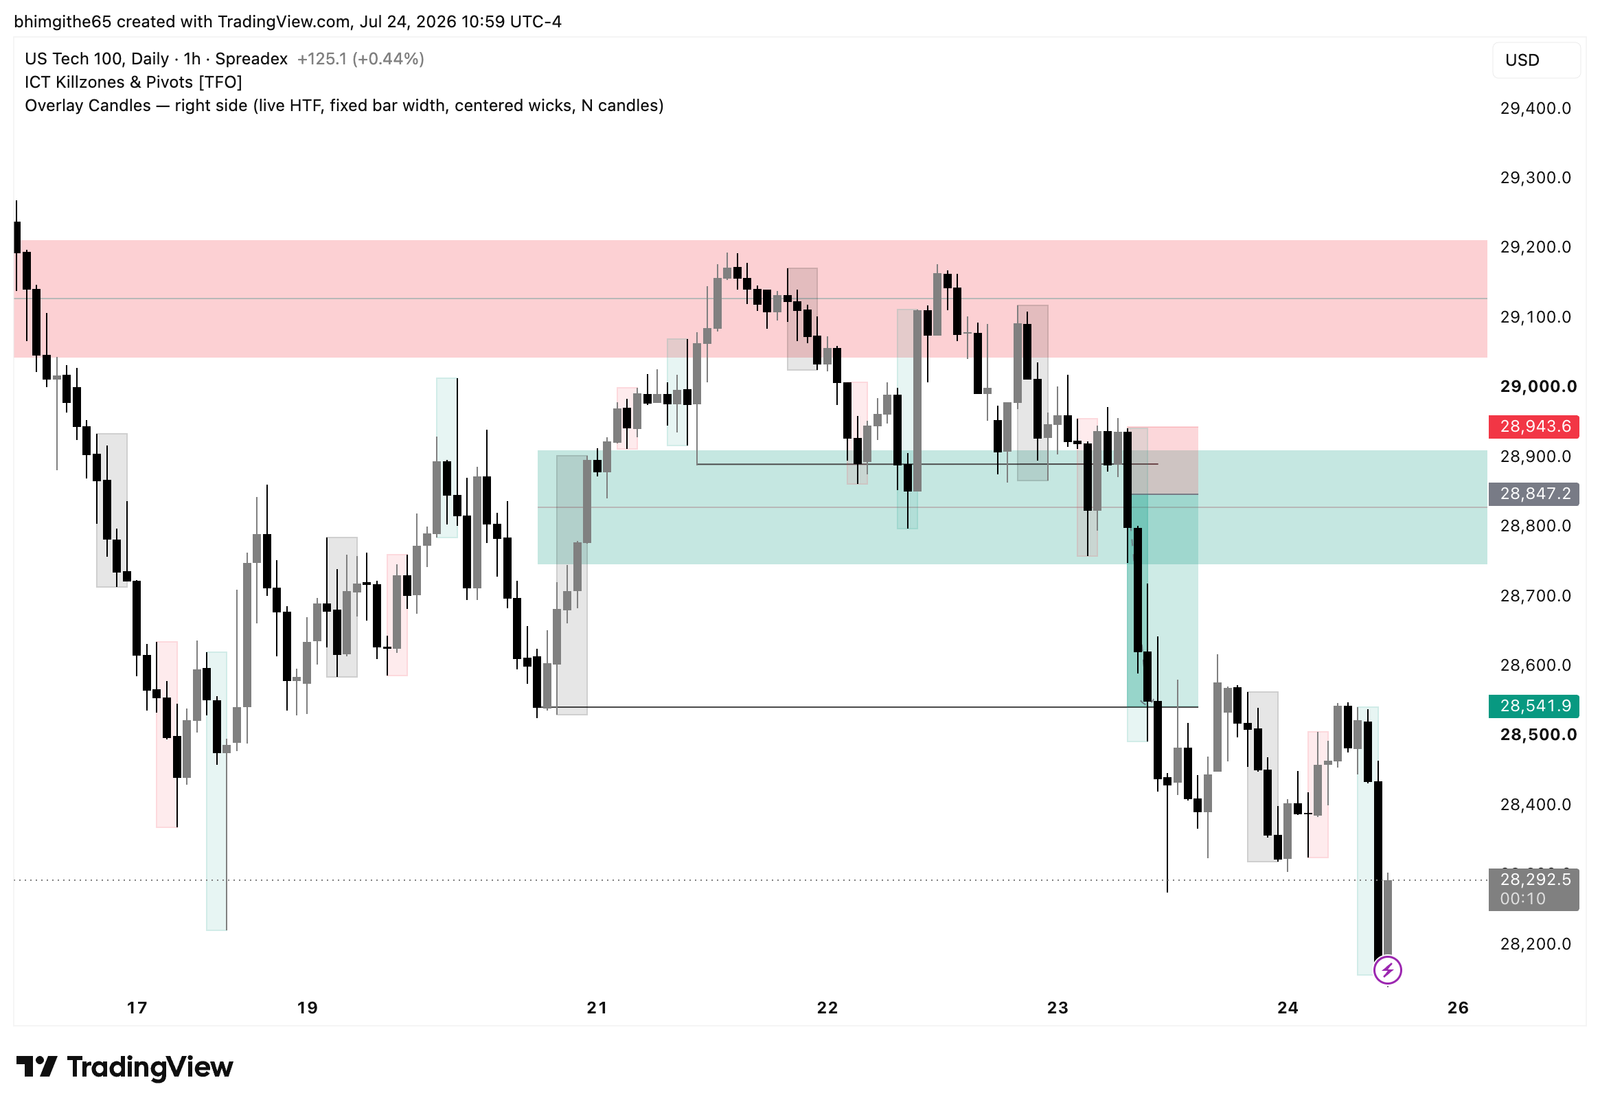
The recorded entry was 28,847.2, the stop was 28,943.6, and the target and exit were 28,541.9. I recorded a win of 3.17R. These are the completed trade facts; the later movement discussed below is a separate hindsight observation. I am sharing the original screenshots so the reasoning can be checked against the chart, while keeping the written journal as the source for what I actually decided.
Why I considered this NDX100 setup
The important part of this setup was the conflict between two higher-timeframe areas. A fair value gap is an area where price moved quickly and left an imbalance on the chart; it is a place to watch, not a guaranteed turning point. I had a bearish daily area and a bullish four-hour area. When both are nearby, simply choosing the one I prefer would be weak analysis. The journal says the market was consolidating between them. The later rejection of the bullish area gave me a clearer reason to act.
4-hour original chart: what it adds
The original four-hour TradingView screenshot is included here, unchanged. It is one of the three charts saved with this journal, not a generated market image. I use it to inspect the marked zones and the surrounding price action alongside my written notes. A screenshot saved after the event can show what happened around a level, but it cannot by itself prove exactly what I knew at entry or when I made each decision. The four-hour view gives the wider context of the competing areas and the decline.
1-hour original chart: what it adds
The original one-hour TradingView screenshot is included here, unchanged. It is one of the three charts saved with this journal, not a generated market image. I use it to inspect the marked zones and the surrounding price action alongside my written notes. A screenshot saved after the event can show what happened around a level, but it cannot by itself prove exactly what I knew at entry or when I made each decision. The one-hour view shows the local move away from the marked zone.
15-minute original chart: what it adds
The original 15-minute TradingView screenshot is included here, unchanged. It is one of the three charts saved with this journal, not a generated market image. I use it to inspect the marked zones and the surrounding price action alongside my written notes. A screenshot saved after the event can show what happened around a level, but it cannot by itself prove exactly what I knew at entry or when I made each decision. The 15-minute view is the timeframe where my note places the structure shift.
Entry, stop and the recorded result
I sold at 28,847.2 with my stop at 28,943.6 and take-profit at 28,541.9. For a short, the stop sat above entry and the target below it. The risk was 96.4 index points and the recorded move to exit was 305.3 points, matching the journal’s 3.17R after rounding. I recorded the trade as a win and marked myself confident before it and satisfied afterward. I did not record a mistake tag.
What happened afterward
Price continued lower after my exit. In hindsight I wrote that a target near the daily low might have produced around 1:6, while I actually took about 1:3. I want that difference to remain clear: the extra movement was a possible opportunity I saw later, not profit I captured. My note also says I was satisfied with the completed trade. I can review target placement without turning a winning execution into a fictional larger win.
The lesson I am keeping
My lesson was to trade when the path is clear. Here that meant not forcing a view while the daily bearish and four-hour bullish areas were both relevant. I waited for rejection and a 15-minute shift. The practical question for future journals is whether I can state the invalidation and the next likely area before placing the order. A result alone cannot answer that question; the sequence of observations and the written plan are what make this trade worth reviewing.
For my next review, I want to keep the same distinction between setup, execution and result. The entry, stop and exit fields tell me what I actually did. The annotated chart shows the price path I can study later. The lesson field tells me what I wanted to change or repeat. Keeping those three records separate helps me notice a weak process even after a win and a useful decision even after a loss. This is one historical trade, not a prediction about what NDX100 will do next.
Related reading: the free trading journal template I use to keep a consistent record.
This is a retrospective trading journal for education, not a trade recommendation. The featured cover is editorial artwork; the TradingView images are the original screenshots.