
This EURUSD trade journal reviews a New York session sell from July 21, 2026. My setup began with a tap into a four-hour fair value gap and a four-hour rejection candle. I then moved to the 15-minute chart, saw a market structure shift and a fair value gap, and entered on the retest. The entry was 1.14211, the stop was 1.14268, and the exit was 1.14089.
The journal records a 12.2-pip win and an actual reward-to-risk result of 2.14R. I was confident before the trade and satisfied afterward, with no mistake tags. The lesson I saved was about matching the confirmation timeframe to the higher-timeframe area and avoiding entries while the market is still consolidating.
The trade numbers and setup sequence
The stop sat 5.7 pips above the sell entry, while the target was 12.2 pips below it. That relationship produces approximately 2.14R, matching the saved result. My setup tags included FVG Retest, Liquidity Sweep, Session Sweep, Displacement, 15 Min MSS, and FVG Tap Entry.
Those tags describe several observations, but the central sequence was simple: price reached the four-hour area, rejected, shifted structure on the 15-minute chart, and returned to the smaller fair value gap. I used that retest for the sell rather than entering only because price had touched the larger zone.
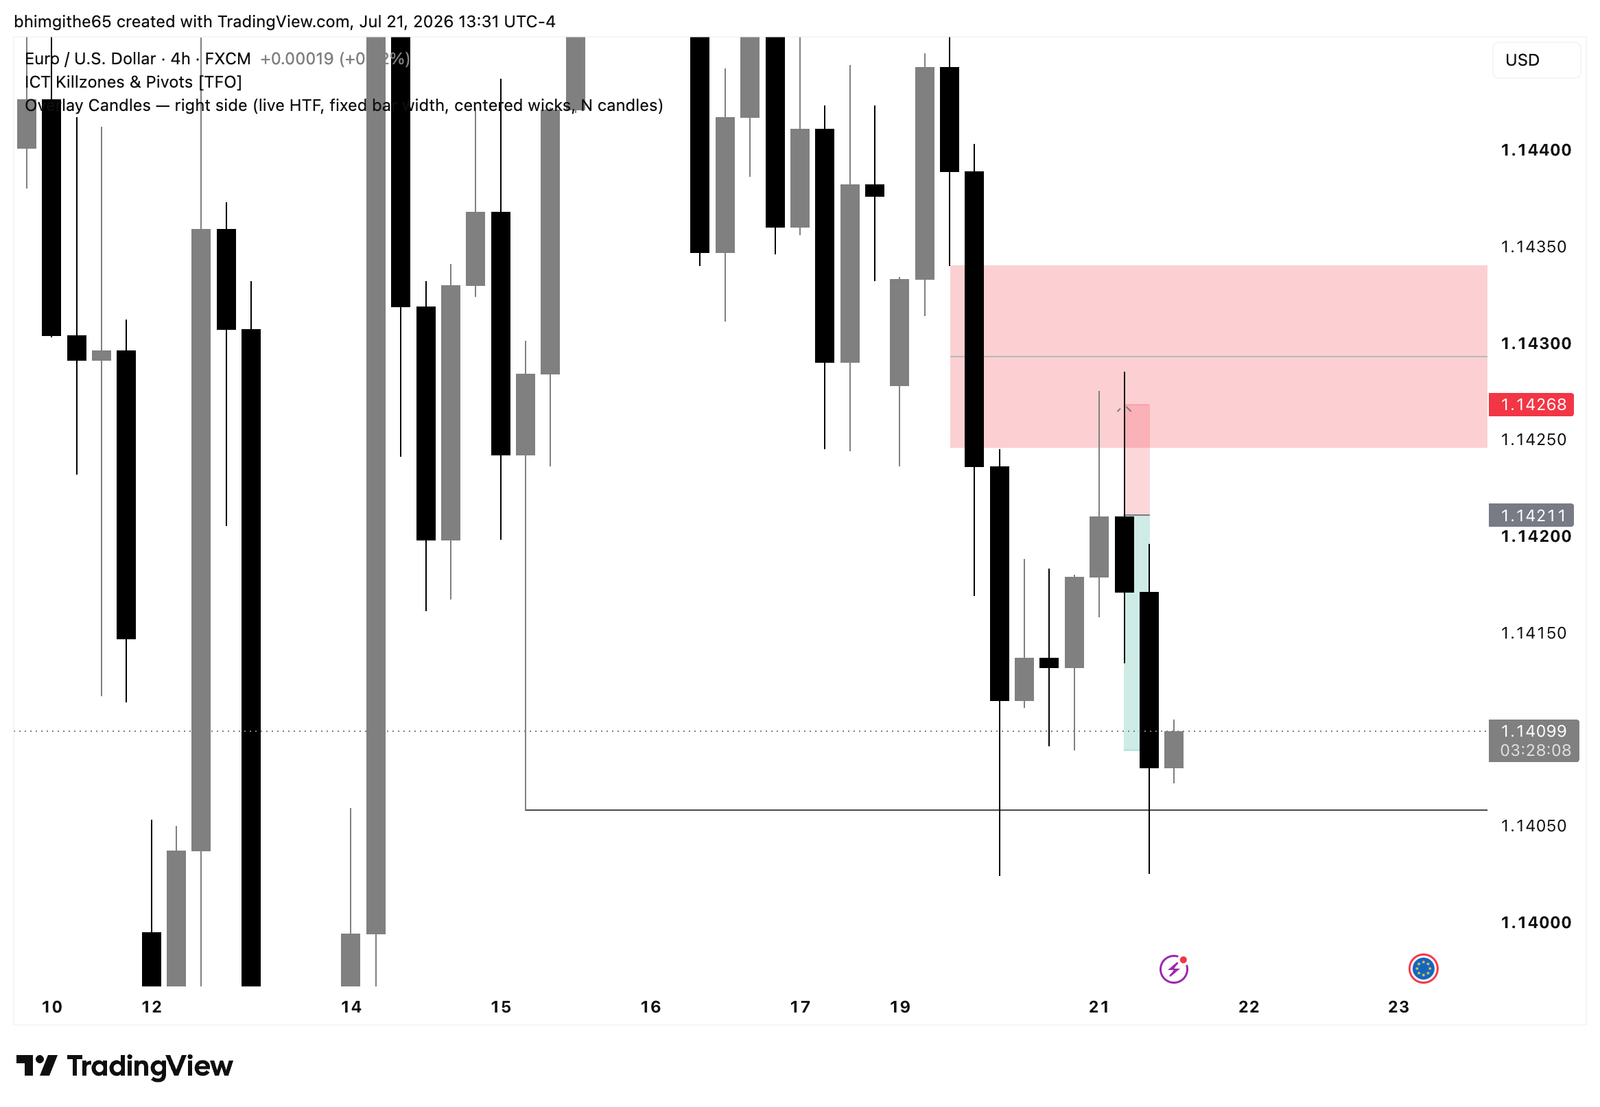
Four-hour chart: the area that started the idea
The four-hour screenshot provides the highest-timeframe evidence attached to this trade. It shows the marked fair value gap area and the sell position below it. My journal says a four-hour rejection candle closed after the tap, which gave me a reason to look for bearish confirmation on a smaller chart.
A higher-timeframe area can define context, but it does not give exact execution by itself. Waiting for the rejection candle helped separate a simple touch from an actual reaction. I then moved down in timeframe instead of assuming the area had to hold.
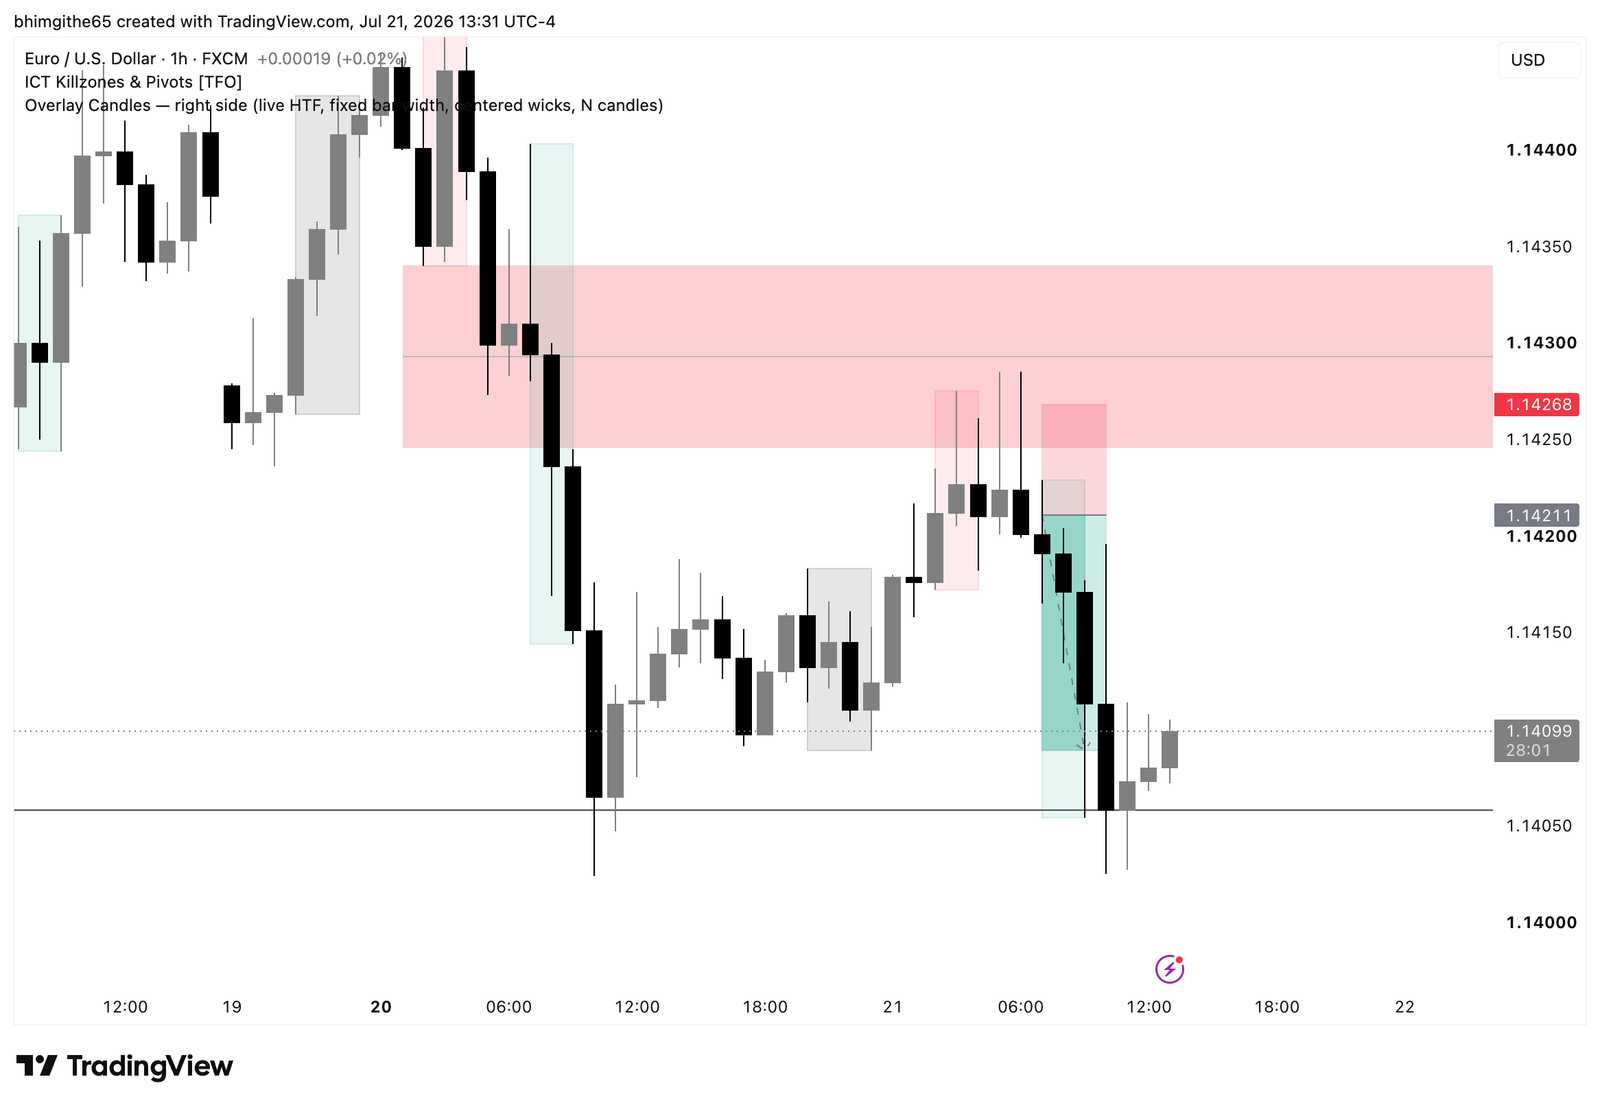
One-hour chart: keeping the pullback in context
The one-hour screenshot shows the decline into the lower area, the pullback, and the renewed move down. It connects the four-hour idea to the more precise 15-minute execution. The marked stop remains above the entry, while the target sits near the lower swing area.
This middle view matters because it shows that the trade was not based on a single isolated candle. The market had already moved lower, retraced, and then offered a place to watch for continuation. I still needed the lower-timeframe structure change before treating the pullback as my entry.
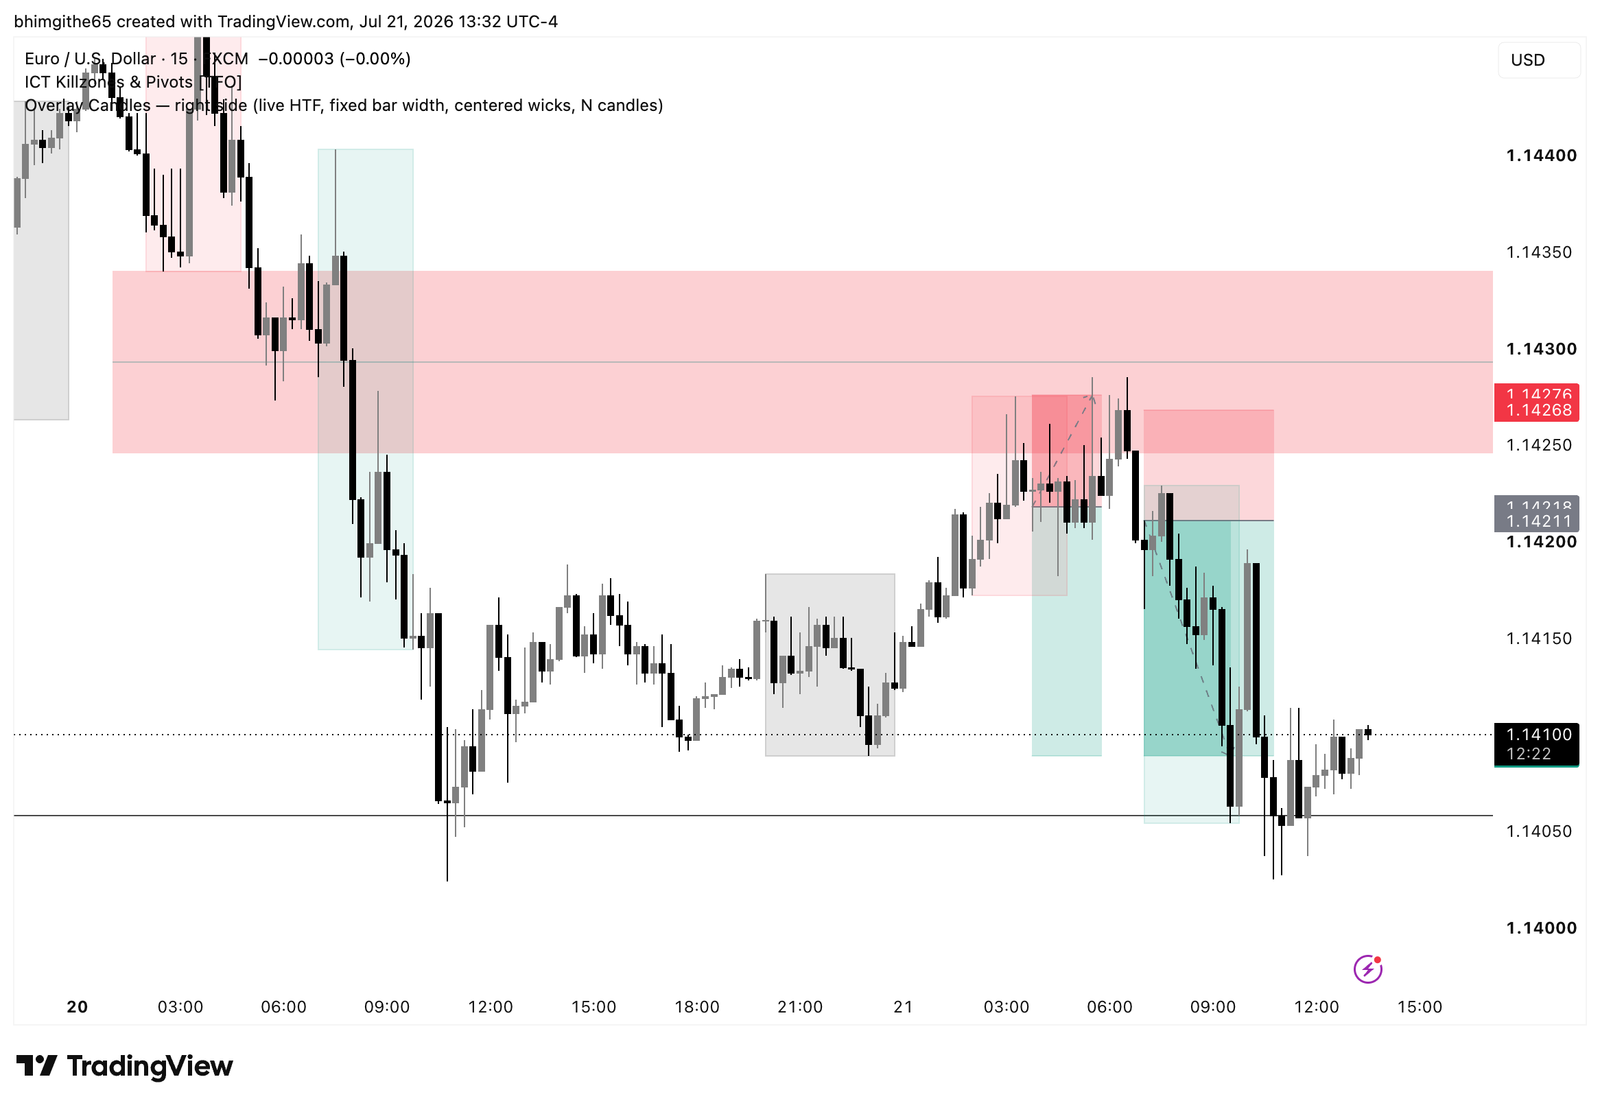
15-minute MSS, displacement, and retest
The 15-minute screenshot preserves the execution chart. My notes record a market structure shift and a fair value gap on this timeframe. I entered when price retested that 15-minute gap, using 1.14268 as the invalidation level and 1.14089 as the target.
A market structure shift means the recent sequence of short-term highs and lows changes direction. Displacement describes a strong move away from an area. For this journal, those ideas mattered because they supplied the bearish confirmation I wanted after the four-hour rejection. They were not guarantees; they were the conditions in my plan.
The actual result versus the possible 3R outcome
Price reached the recorded exit for 12.2 pips and approximately 2.14R. My later-price note says the market continued lower and that a 3R target could also have been reached. That observation may help when I study target placement, but it does not change the completed result.
I want to keep actual performance separate from hindsight. The trade I executed finished at 2.14R. The possible 3R move is an alternative that became visible later. Treating them separately gives me cleaner journal data and prevents me from improving a past trade after the outcome is known.
The rule I want to carry forward
My lesson was specific: when price taps a four-hour fair value gap, look for a 15-minute market structure shift or displacement. For a one-hour fair value gap, use the five-minute or one-minute chart for confirmation. Most importantly, do not enter while price is simply consolidating.
This EURUSD trade journal is one example where that sequence worked. The useful part is the alignment between the higher-timeframe area and the lower-timeframe confirmation, together with a defined stop and target. I want to repeat the patience and structure of the decision, while accepting that another valid setup can still produce a loss.
Related reading: my earlier NDX100 journal about waiting for lower-timeframe confirmation.
This is a retrospective trading journal, not a recommendation to enter a trade. The featured cover is AI-generated editorial artwork; the 3 TradingView charts are the original journal screenshots.