
This EURUSD trade journal covers a sell I took during the New York session on July 20, 2026. My market view was bearish, and I watched price break out of consolidation before pulling back. I entered at 1.14212, placed my stop at 1.14280, and exited at my target of 1.14074. The journal records a 13.8-pip win and an actual result of 2R.
I was confident before the trade and satisfied afterward. I marked no mistake tags. The result was positive, but the useful part of the review is the sequence: bearish context, continuation behavior, a pullback, and renewed selling pressure. My lesson was simply to follow my rules and stay disciplined.
The trade numbers and planned risk
The stop was 6.8 pips above my sell entry, while the target was 13.8 pips below it. That produced a planned reward of roughly twice the risk, which agrees with the 2R result saved in my journal. Recording the exact levels helps me judge the trade by the plan I used rather than by the larger move visible afterward.
My setup tags were FVG Retest, Continuation Entry, and Rejection Opposite FVG. Those labels describe the idea I wrote: price was already bearish, formed a bearish fair value gap, broke the consolidation pattern, and then pulled back before falling again. I treated the retest as a continuation opportunity rather than trying to predict a new reversal.
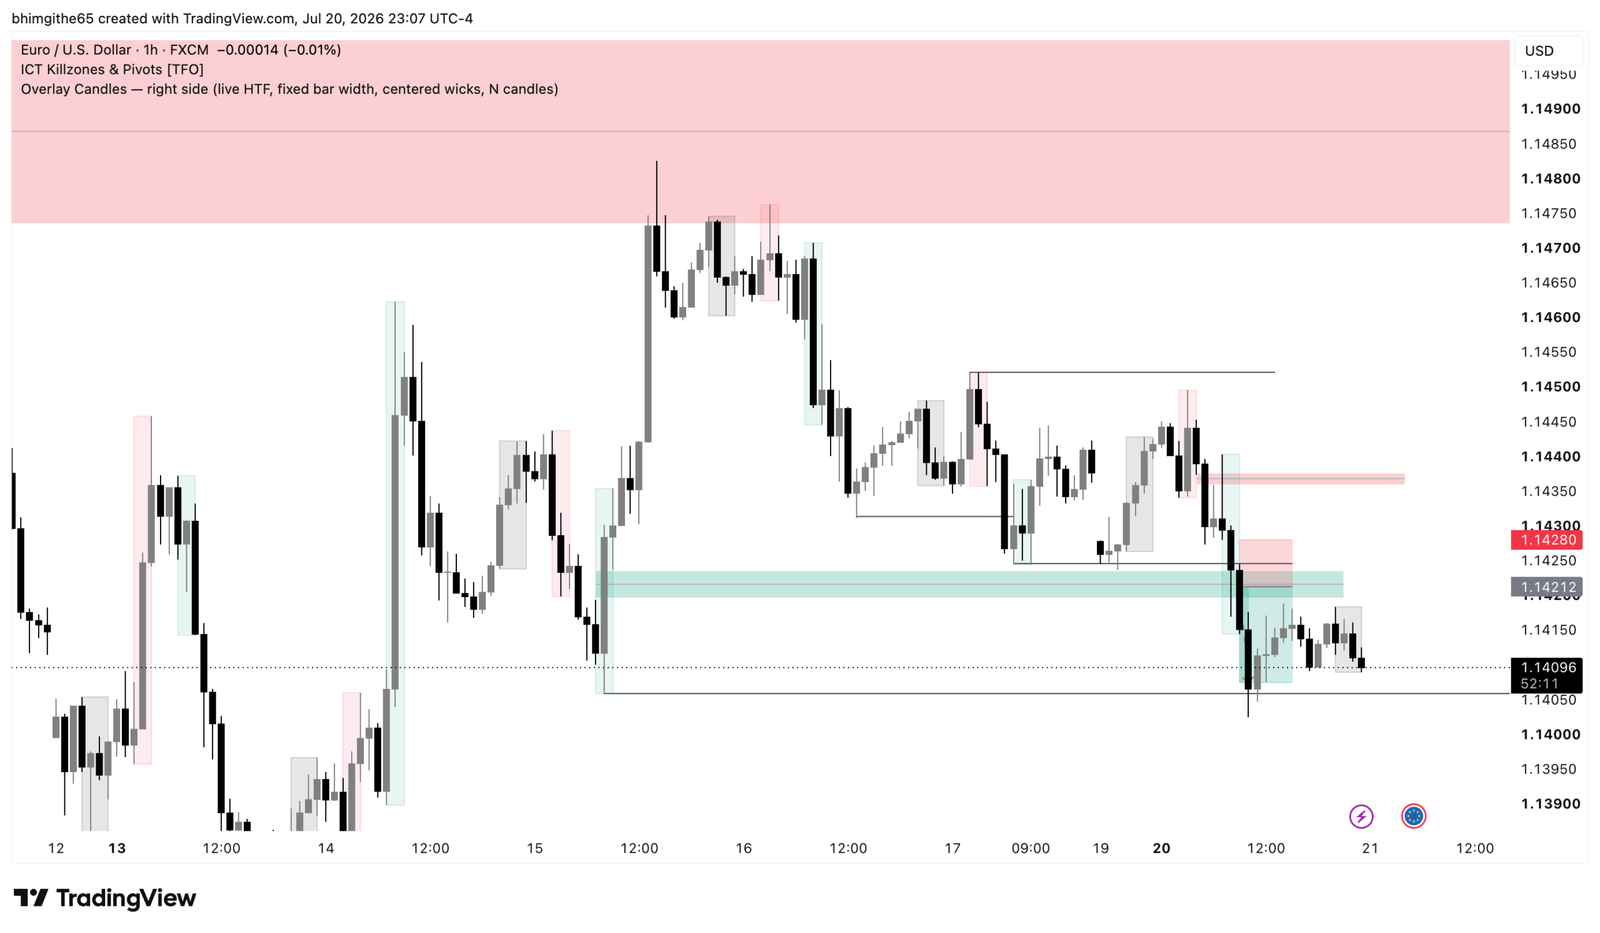
One-hour chart: the wider bearish context
The one-hour screenshot is the broadest chart attached to this entry. It shows the larger decline and the area where price later continued lower. This view helps me keep the execution inside the wider structure instead of reading the smaller candles in isolation.
A fair value gap is an imbalance left by a strong price move. In my process, the area was useful because price returned toward it after bearish movement. The chart does not prove that every gap will hold. It records the specific context I used on this trade: bearish movement had already appeared before I looked for the continuation entry.
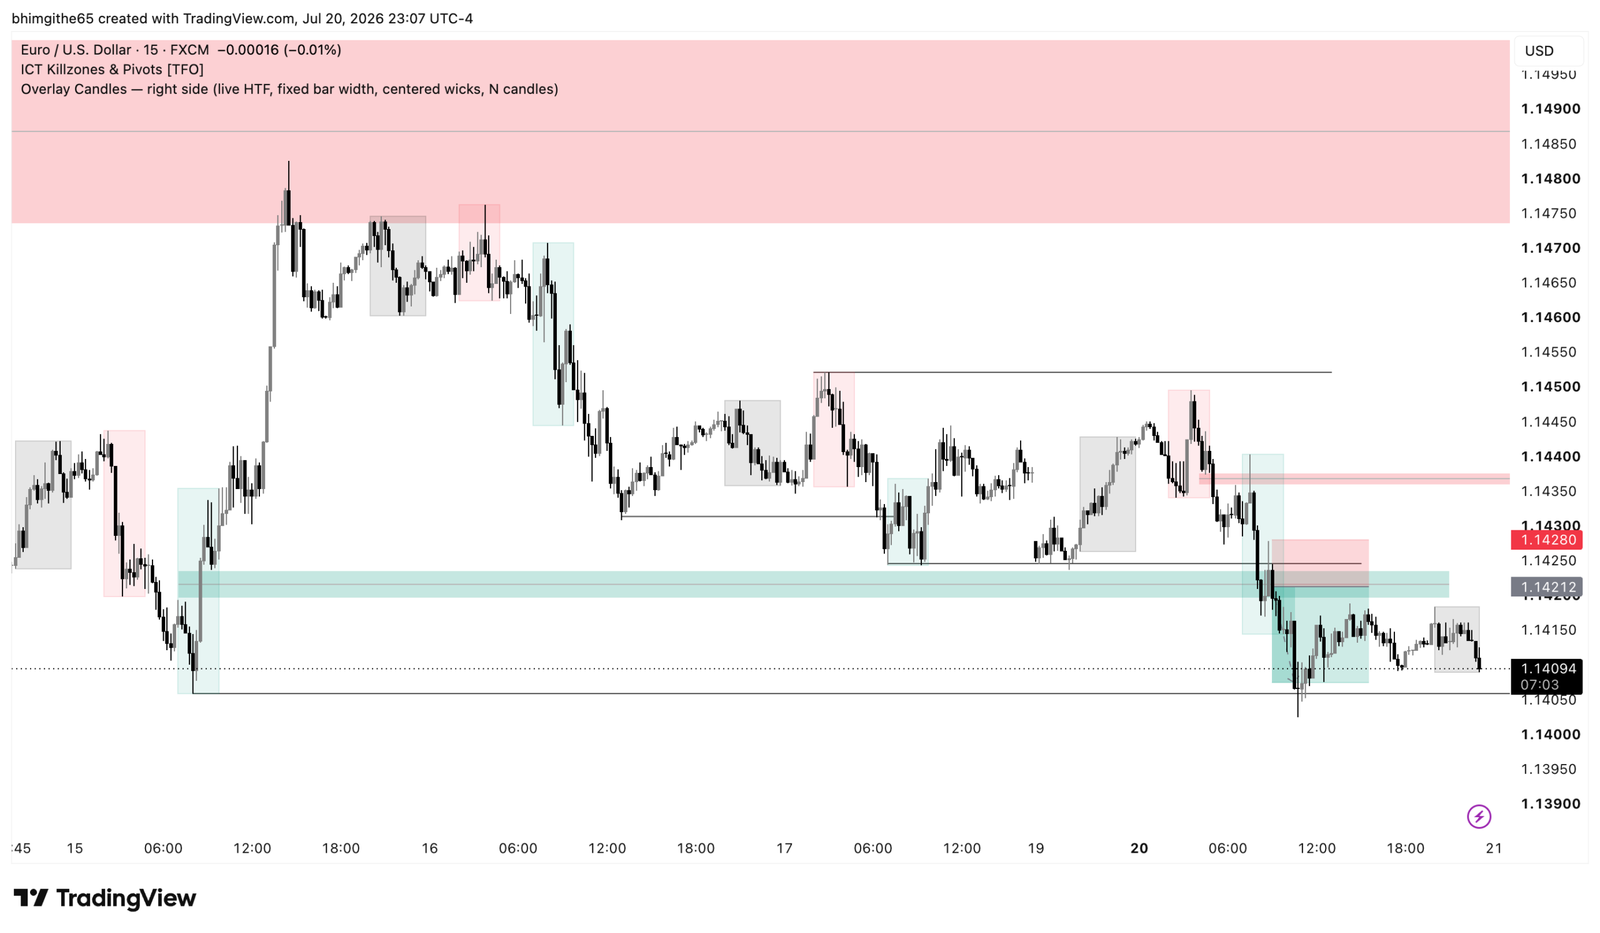
15-minute chart: weakness in the bullish fair value gap
On the 15-minute chart, I noted that price did not respect a one-hour bullish fair value gap. I interpreted that failure as evidence that sellers remained in control and that price could continue toward the next downside area, which I described as the swing low.
The 15-minute screenshot also makes the consolidation break and the later downside move easier to see. I want to remember that the value came from combining the failed bullish area with the existing bearish context. I did not need to treat one candle or one zone as a guarantee.
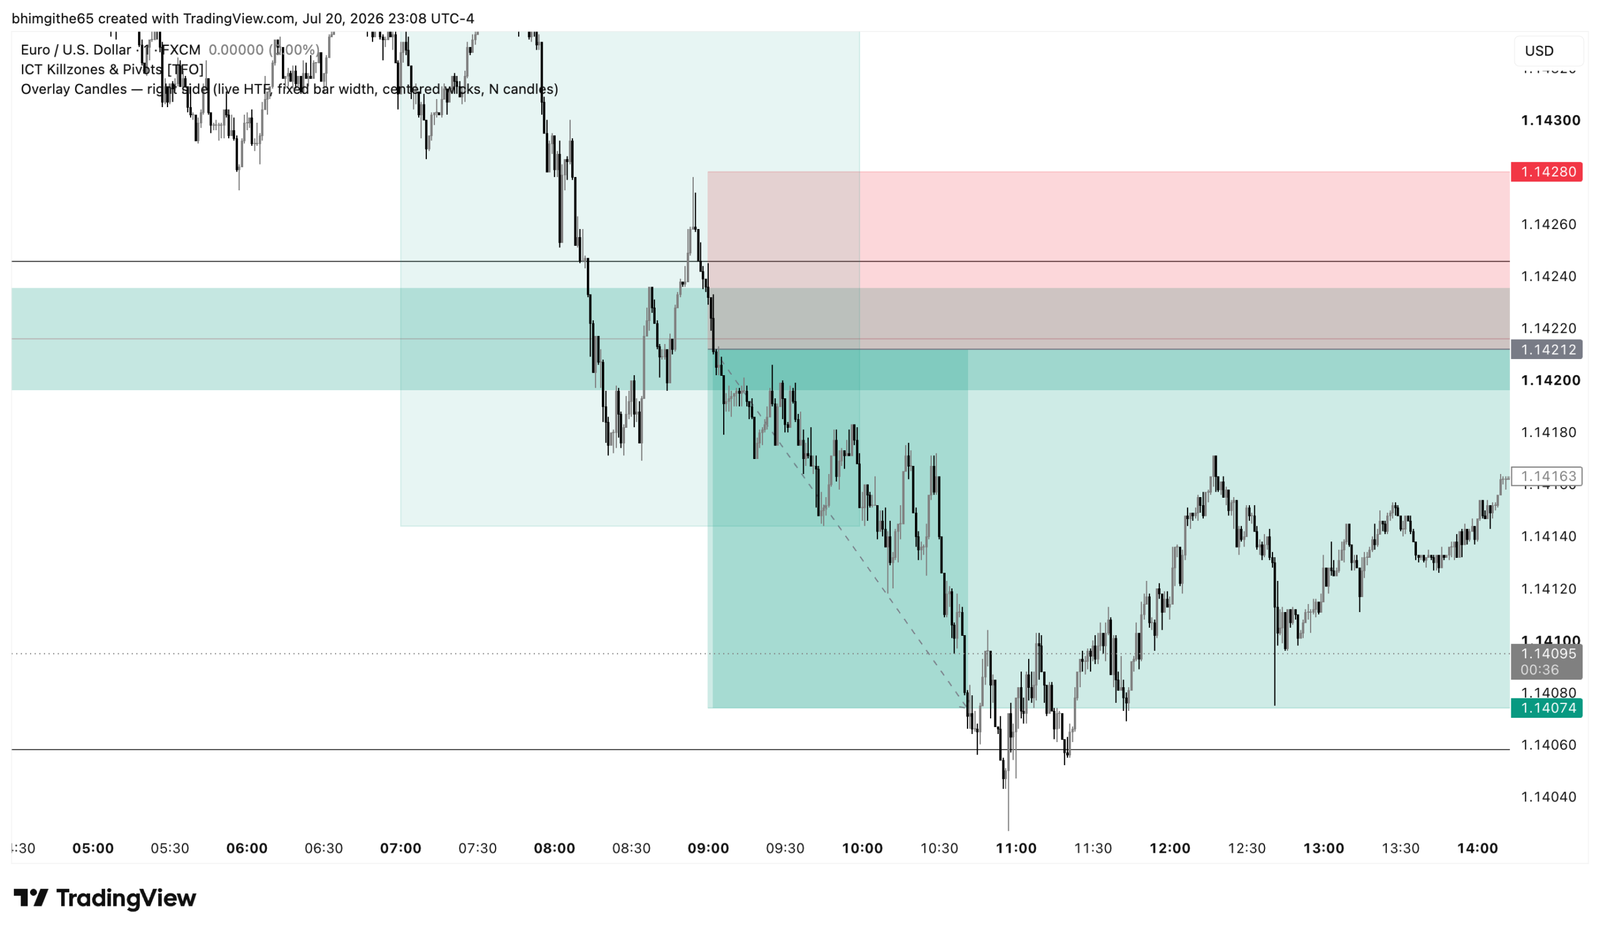
Lower-timeframe execution and the completed result
The smallest saved chart gives a closer view of the short entry at 1.14212, the stop at 1.14280, and the target at 1.14074. Price moved down to the planned exit, so the result recorded for the trade is 13.8 pips and 2R.
The chart later shows price moving below the target before consolidating. My journal says I would not have preferred a 3R target in this context because that larger target would not have been reached before consolidation. That is an important distinction: the completed 2R target matched the trade I planned, while a hypothetical 3R target is only a comparison.
Why discipline mattered more than extending the target
It is easy to look at a winning chart and focus on how much farther price traveled. My note was more balanced. Price moved a little lower after the target, then began to consolidate. I remained comfortable with the exit below the swing area rather than changing the plan to chase an extra unit of reward.
That review supports the lesson I wrote: follow the rules and be disciplined. A consistent target can be more useful for evaluating a strategy than repeatedly moving the objective after seeing later candles. Here the planned 2R was achieved, and the later action did not provide a reason to rewrite the recorded result.
What I want to repeat
The sequence I want to repeat is straightforward. First, establish the bearish context. Next, wait for the consolidation to break and for a pullback into the area I am watching. Then look for price to resume in the original direction, while keeping a defined stop and target.
This EURUSD trade journal represents one successful example, not a promise that the same pattern will always work. The strongest part was that the entry, invalidation, and target were all recorded before the outcome was reviewed. My confidence afterward should come from following that process consistently, whether the next trade wins or loses.
Related reading: my earlier NDX100 journal about waiting for lower-timeframe confirmation.
This is a retrospective trading journal, not a recommendation to enter a trade. The featured cover is AI-generated editorial artwork; the 3 TradingView charts are the original journal screenshots.