
This EUR/USD trade journal covers my sell on July 31, 2026 during the New York session. Price had been moving higher, so this EUR/USD sell was a counter-trend idea. My journal says a nearby four-hour bullish fair value gap failed to hold and price rejected that area. I then looked toward the next four-hour fair value gap as a target. The trade reached my recorded exit, but the reason I want to remember it is the change in how I read the first point of interest.
The recorded entry was 1.15048, the stop was 1.15170, and the target and exit were 1.14724. I recorded a 2.66R win. These are the completed trade facts; the later movement discussed below is a separate hindsight observation. I am sharing the original screenshots so the reasoning can be checked against the chart, while keeping the written journal as the source for what I actually decided.
Why I considered this EUR/USD setup
A point of interest, or POI, is simply an area I have marked for possible price reaction. It is not a command to trade. Here I had to respond to the first area failing rather than keep assuming it would support the upward move. My note says the next price-delivery array, another four-hour gap, became the target. That explains why I considered a short even though the preceding move had been higher. It also explains why the trade remained a counter-trend case rather than a broad bearish prediction.
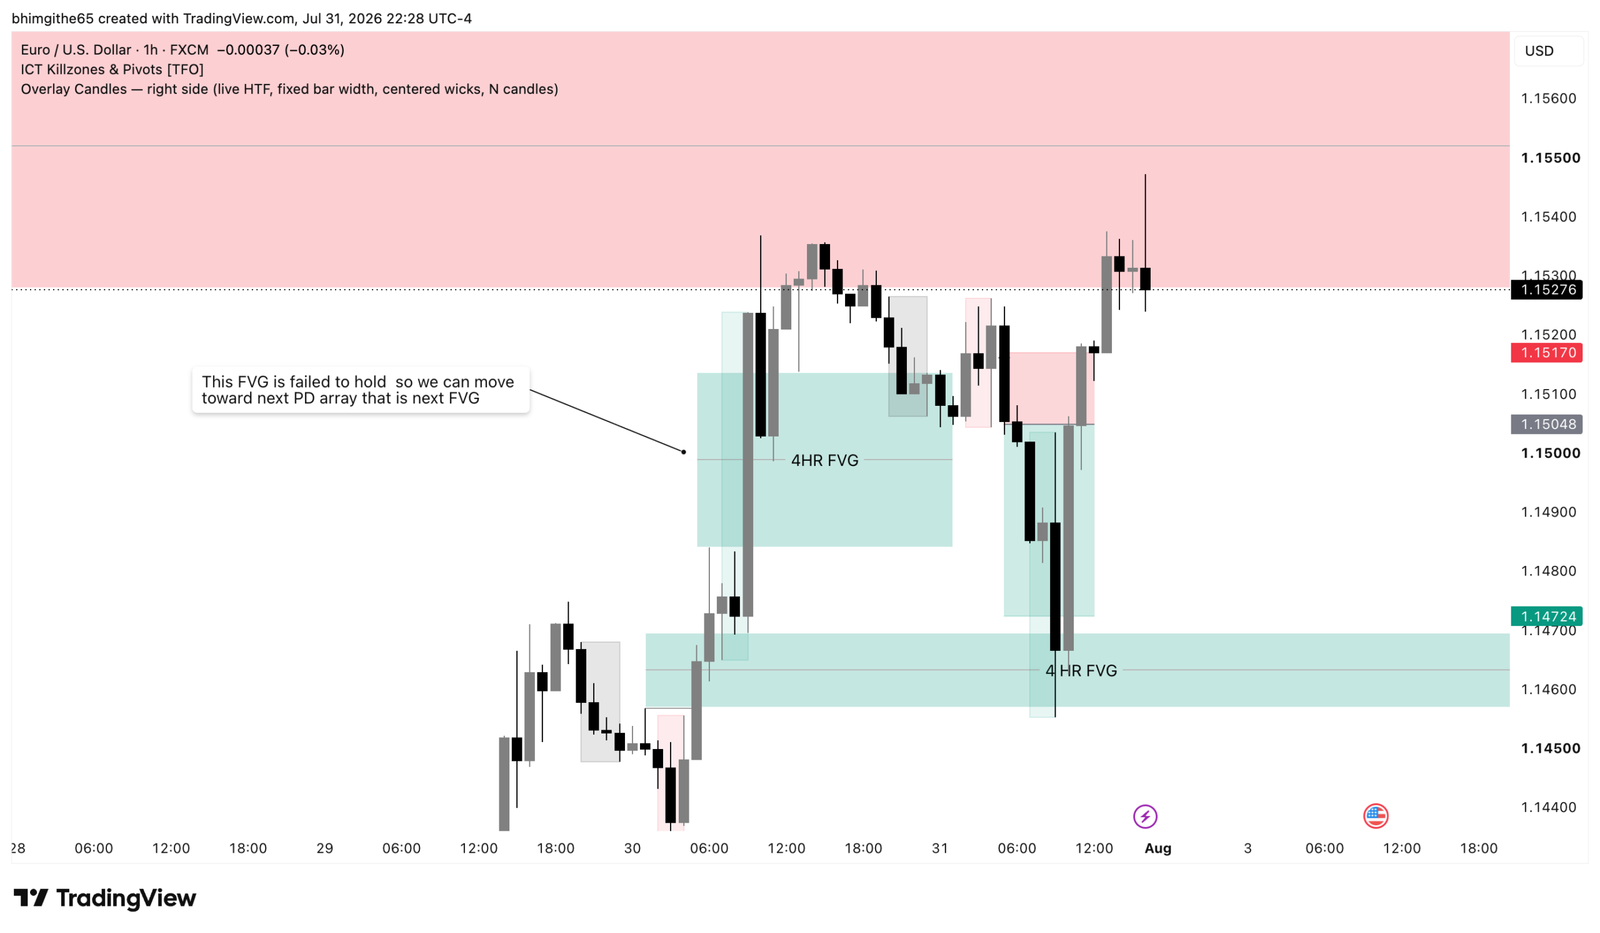
1-hour original chart: what it adds
The original one-hour TradingView screenshot is included here, unchanged. It is one of the three charts saved with this journal, not a generated market image. I use it to inspect the marked zones and the surrounding price action alongside my written notes. A screenshot saved after the event can show what happened around a level, but it cannot by itself prove exactly what I knew at entry or when I made each decision. The one-hour image gives a wider view of the failed area and next zone.
15-minute original chart: what it adds
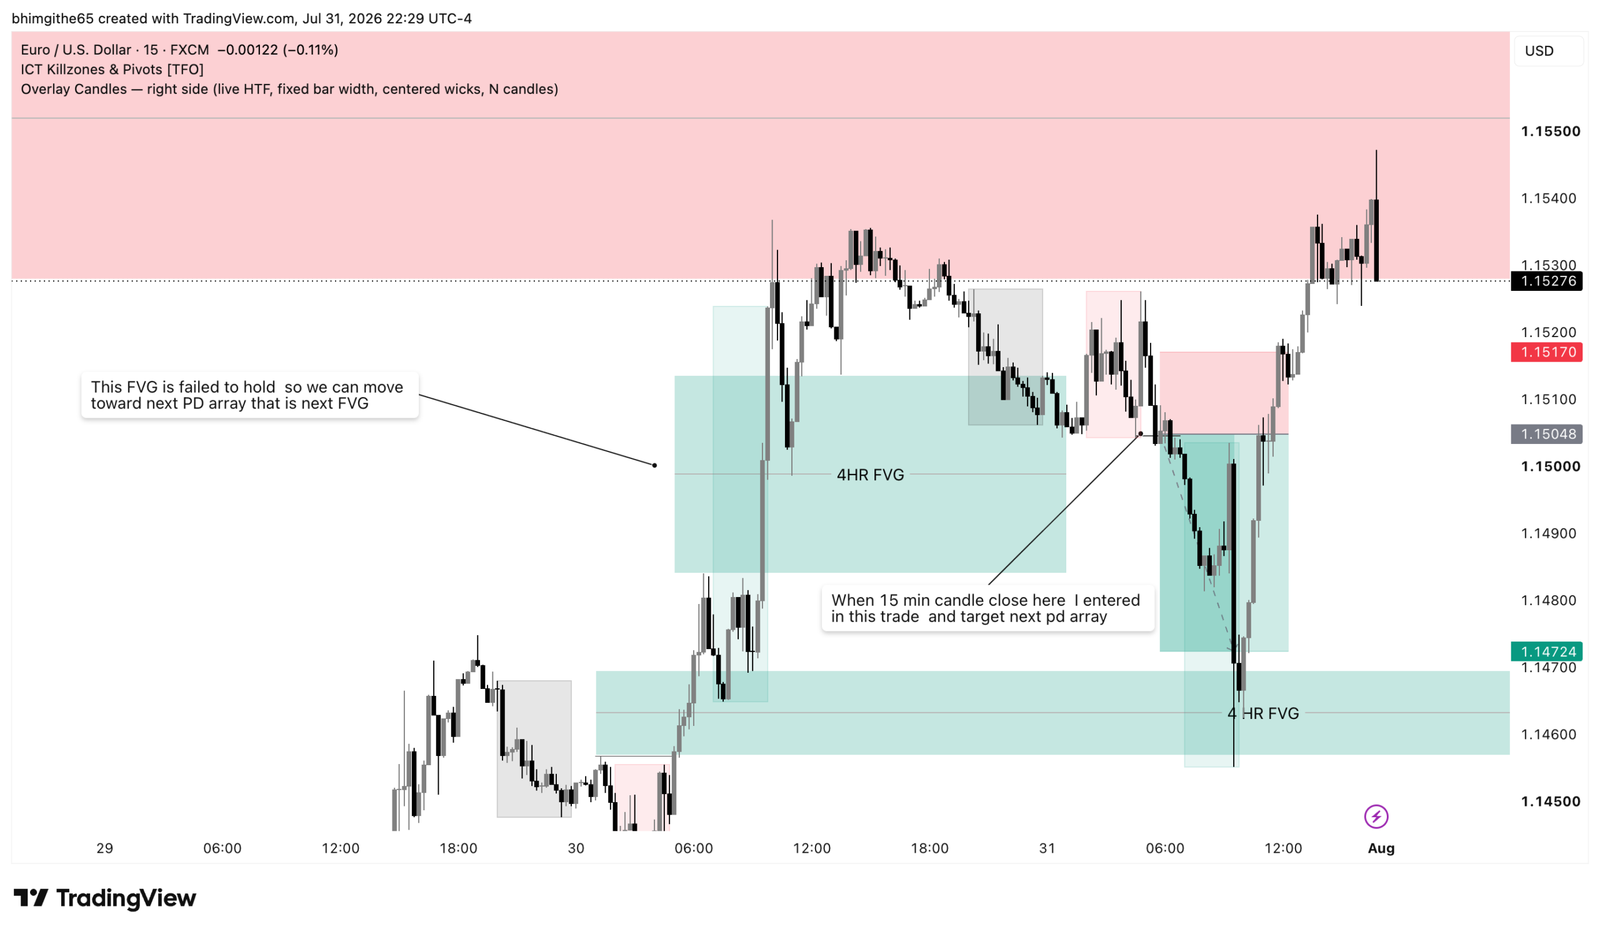
The original 15-minute TradingView screenshot is included here, unchanged. It is one of the three charts saved with this journal, not a generated market image. I use it to inspect the marked zones and the surrounding price action alongside my written notes. A screenshot saved after the event can show what happened around a level, but it cannot by itself prove exactly what I knew at entry or when I made each decision. The 15-minute image carries my annotations about the failed gap and the move toward the next one.
5-minute original chart: what it adds
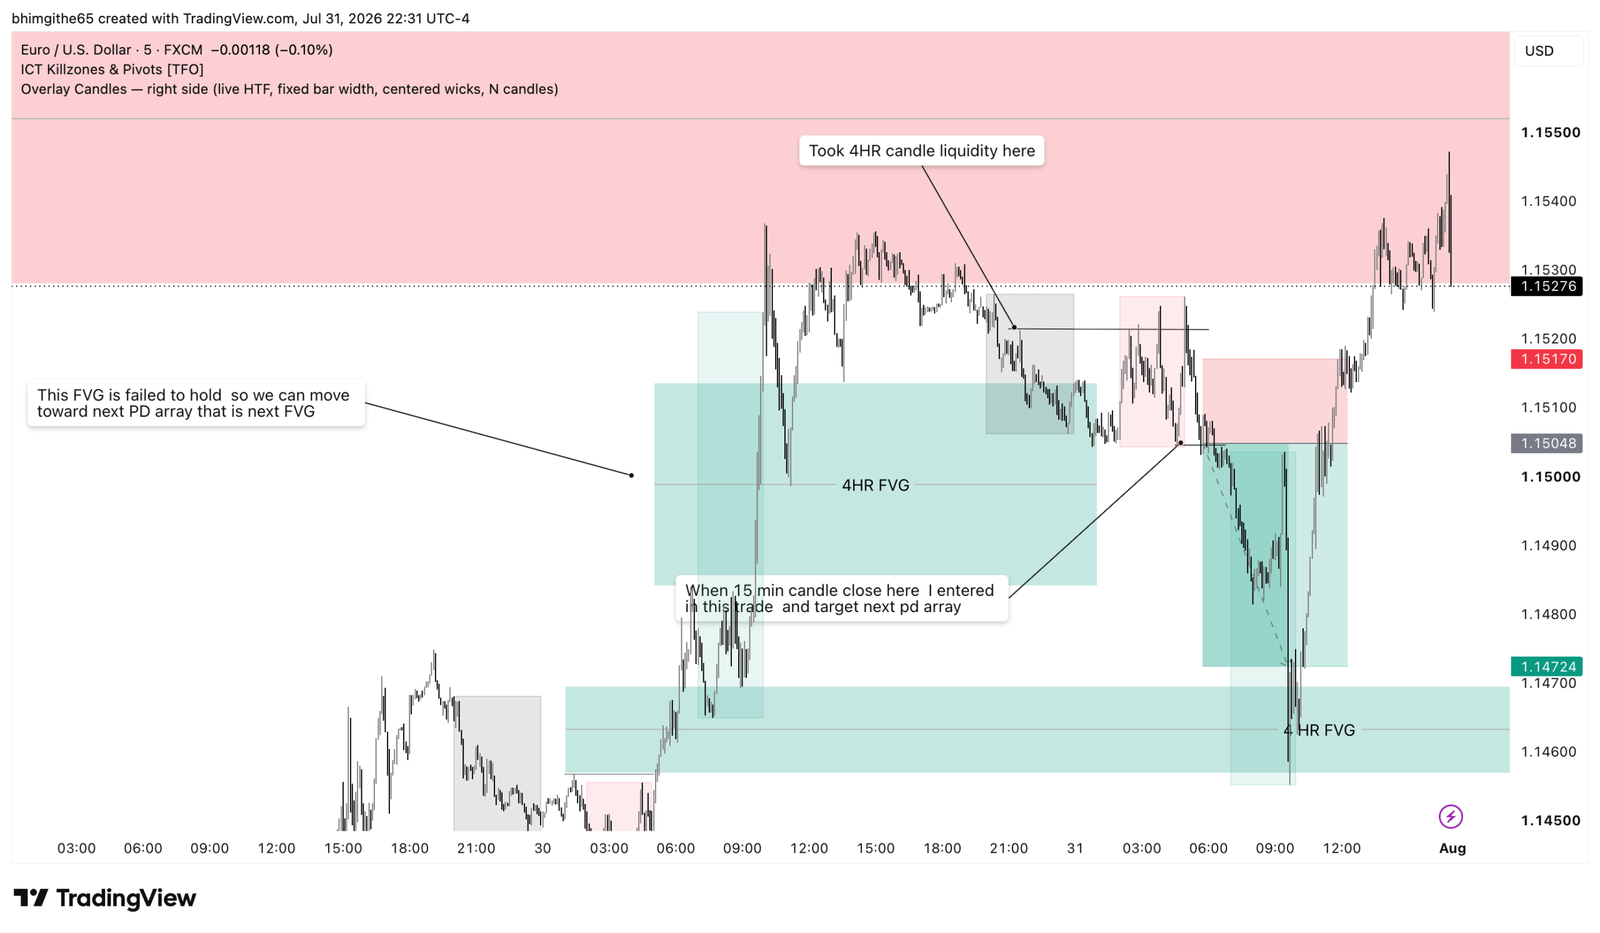
The original five-minute TradingView screenshot is included here, unchanged. It is one of the three charts saved with this journal, not a generated market image. I use it to inspect the marked zones and the surrounding price action alongside my written notes. A screenshot saved after the event can show what happened around a level, but it cannot by itself prove exactly what I knew at entry or when I made each decision. The five-minute image shows the same idea at closer scale.
Entry, stop and the recorded result
I sold at 1.15048 with the stop at 1.15170 and the target and exit at 1.14724. The stop was 12.2 pips above entry, and the recorded exit was 32.4 pips below it. That gives approximately 2.66R, matching my journal. I marked the result as a win in the New York session. My emotions were recorded as confident before and satisfied after, and I did not mark a mistake. The target was the next planned area, not an arbitrary number chosen after the chart was complete.
What happened afterward
My later note says price reacted upward after touching that next fair value gap. I also wrote about Friday: I was not looking to keep trading after New York because I wanted positions closed before sleep. These are constraints I actually recorded. They matter because a counter-trend move can be temporary; in this case I planned to take the move to a nearby area rather than turn it into a claim about the whole market. The images show the failed area and subsequent target region from several views.
The lesson I am keeping
The lesson I wrote was that when the first POI fails to hold, the next POI can become the target. I should still treat that as a framework for observing price, not a rule that guarantees the next area will be reached. In a future review I want to mark what would invalidate the counter-trend idea and decide how the session and day affect my exit. This entry is most useful as an example of adapting to evidence while keeping the target and stop explicit.
For my next review, I want to keep the same distinction between setup, execution and result. The entry, stop and exit fields tell me what I actually did. The annotated chart shows the price path I can study later. The lesson field tells me what I wanted to change or repeat. Keeping those three records separate helps me notice a weak process even after a win and a useful decision even after a loss. This is one historical trade, not a prediction about what EUR/USD will do next.
Related reading: the free trading journal template I use to keep a consistent record.
This is a retrospective trading journal for education, not a trade recommendation. The featured cover is editorial artwork; the TradingView images are the original screenshots.