
This EUR/USD trade journal covers my sell on July 27, 2026 during the London session. This was a short built around a rejection from a four-hour fair value gap. My journal says I also saw market structure shift on the five-minute and one-minute candles. After a candle closed, I placed a sell-limit order and it was filled. The point I wrote down afterward was simple: follow the plan and trust it.
The recorded entry was 1.14074, the stop was 1.14182, and the target and exit were 1.13774. I recorded a win of about 2.78R. These are the completed trade facts; the later movement discussed below is a separate hindsight observation. I am sharing the original screenshots so the reasoning can be checked against the chart, while keeping the written journal as the source for what I actually decided.
Why I considered this EUR/USD setup
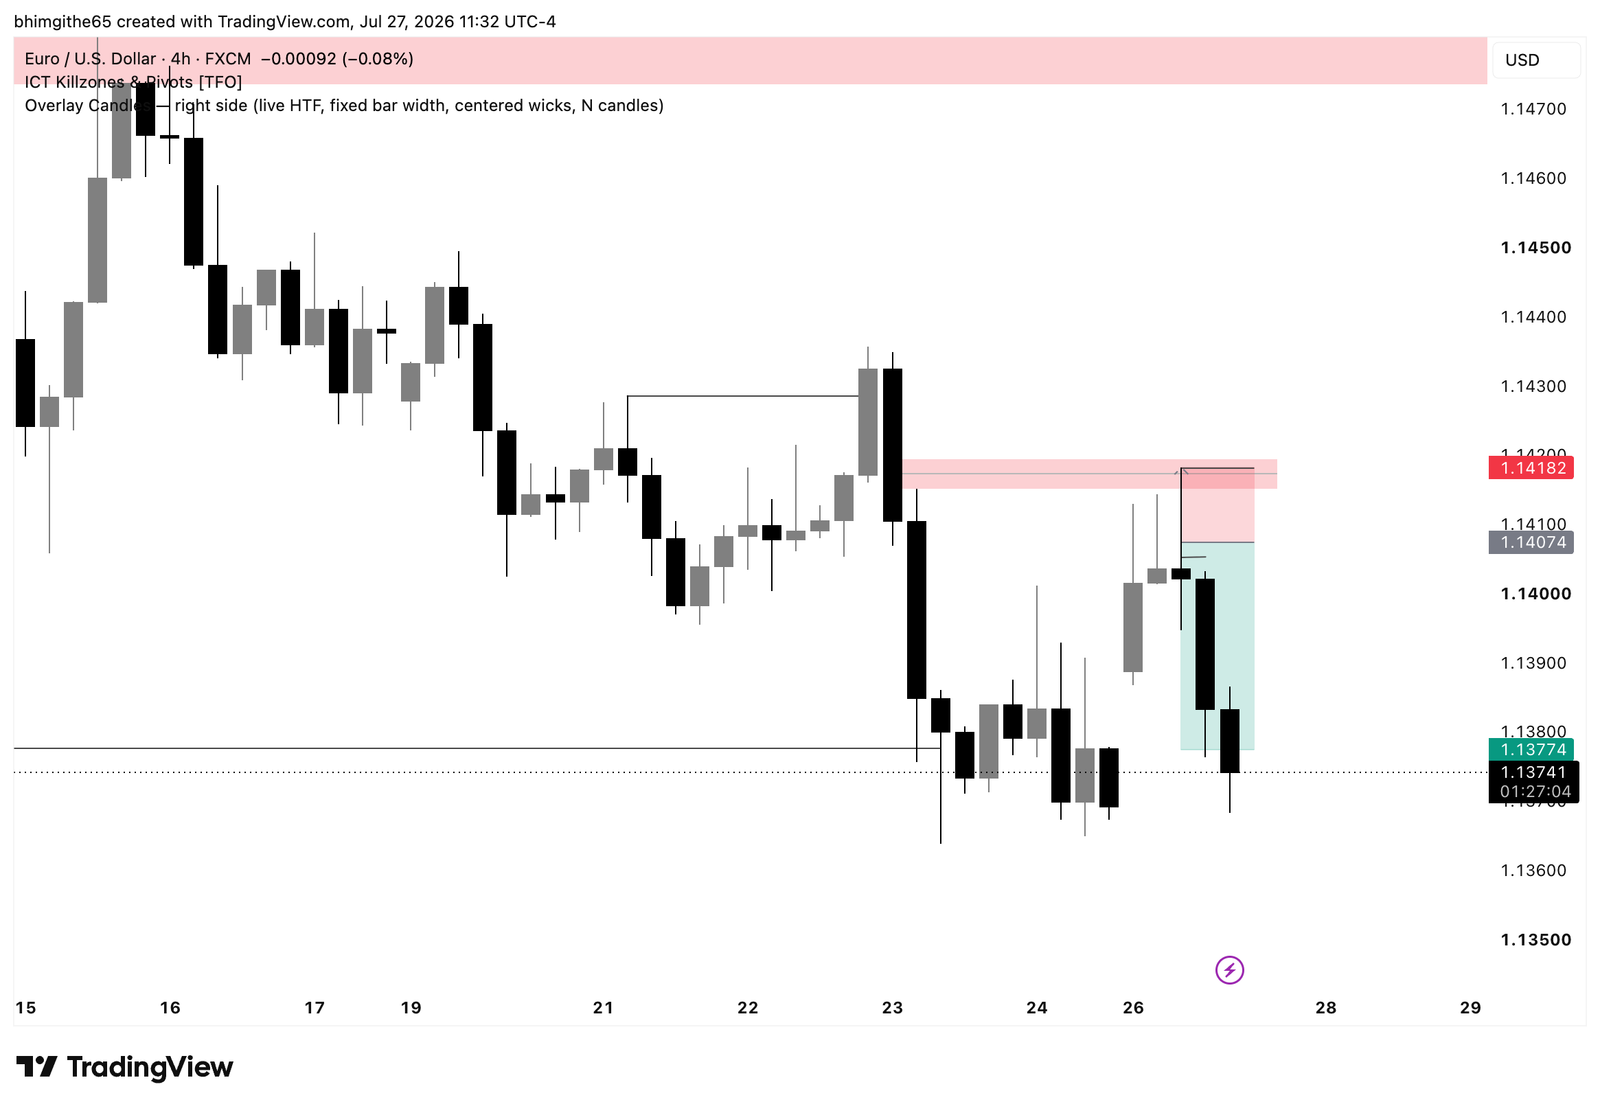
I started with the four-hour fair value gap rather than treating a lower-timeframe move on its own as enough. A fair value gap is a zone left by a strong move; it tells me where I want to observe price reaction, not where price must reverse. The rejection gave me the broader idea for the short. My notes then refer to lower-timeframe structure. That sequence matters because it separates the area I was watching from the entry step I eventually used.
4-hour original chart: what it adds
The original four-hour TradingView screenshot is included here, unchanged. It is one of the three charts saved with this journal, not a generated market image. I use it to inspect the marked zones and the surrounding price action alongside my written notes. A screenshot saved after the event can show what happened around a level, but it cannot by itself prove exactly what I knew at entry or when I made each decision. The four-hour view relates to the gap rejection that started my short idea.
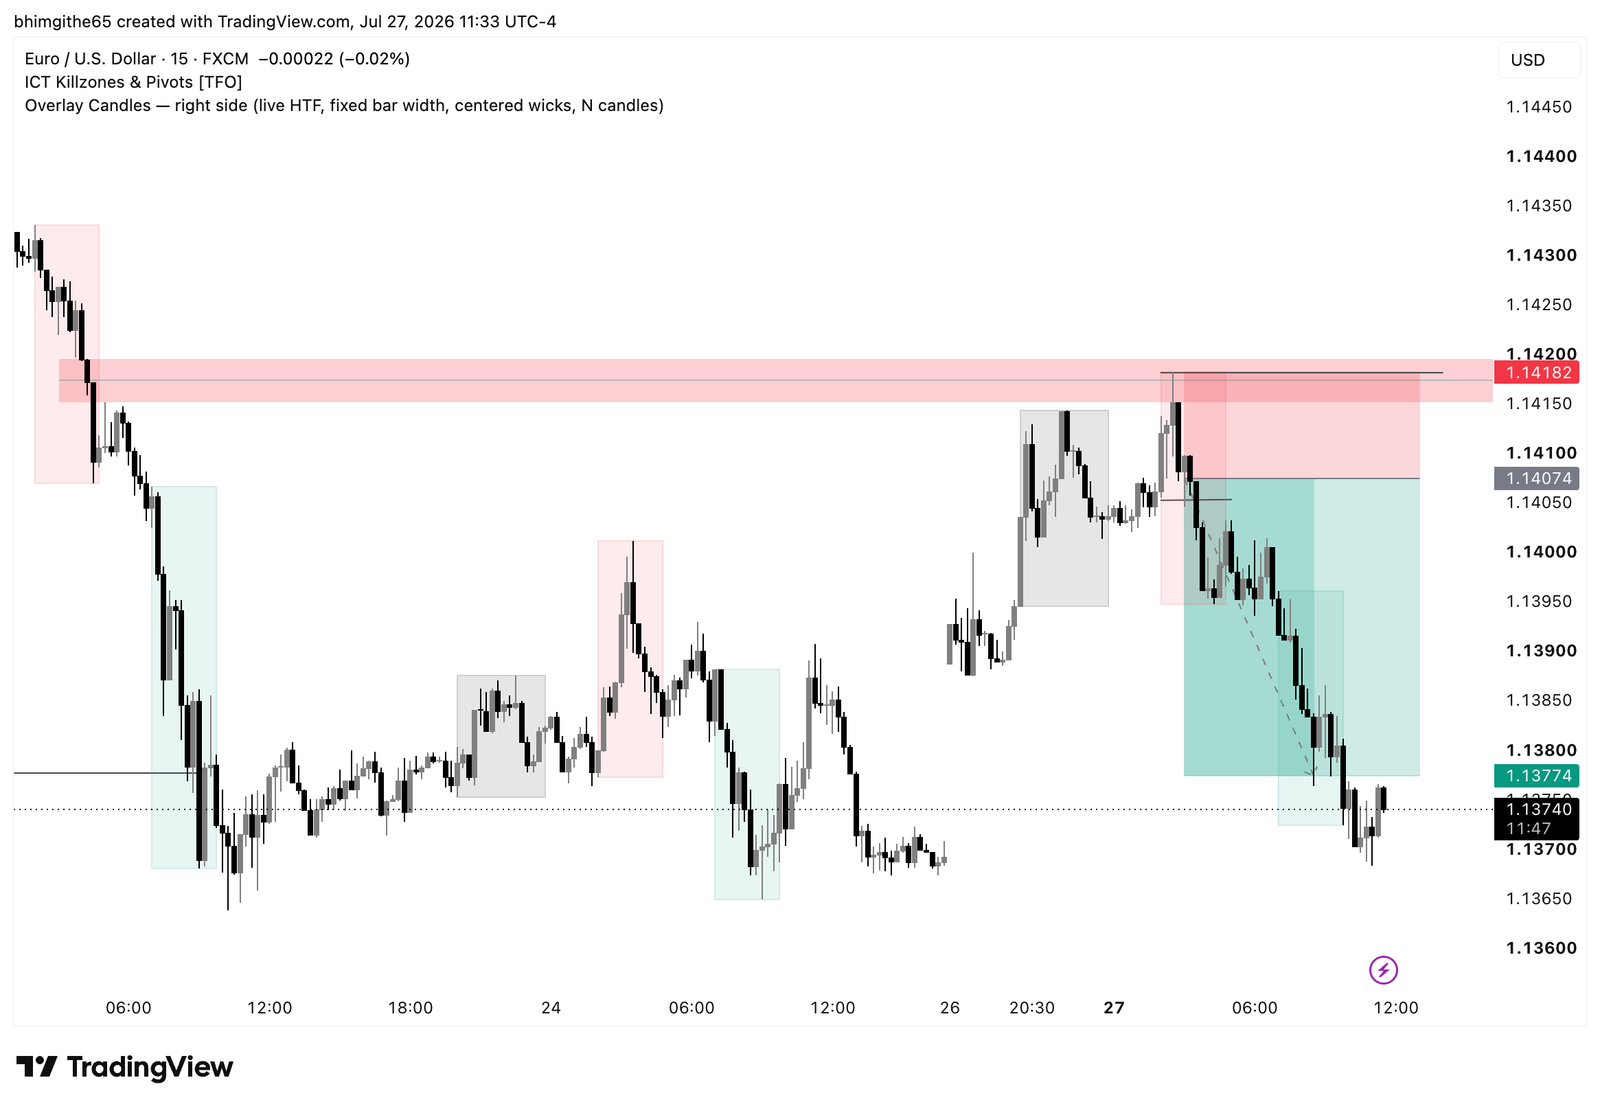
15-minute original chart: what it adds
The original 15-minute TradingView screenshot is included here, unchanged. It is one of the three charts saved with this journal, not a generated market image. I use it to inspect the marked zones and the surrounding price action alongside my written notes. A screenshot saved after the event can show what happened around a level, but it cannot by itself prove exactly what I knew at entry or when I made each decision. The 15-minute image adds the intermediate view of the sell area.
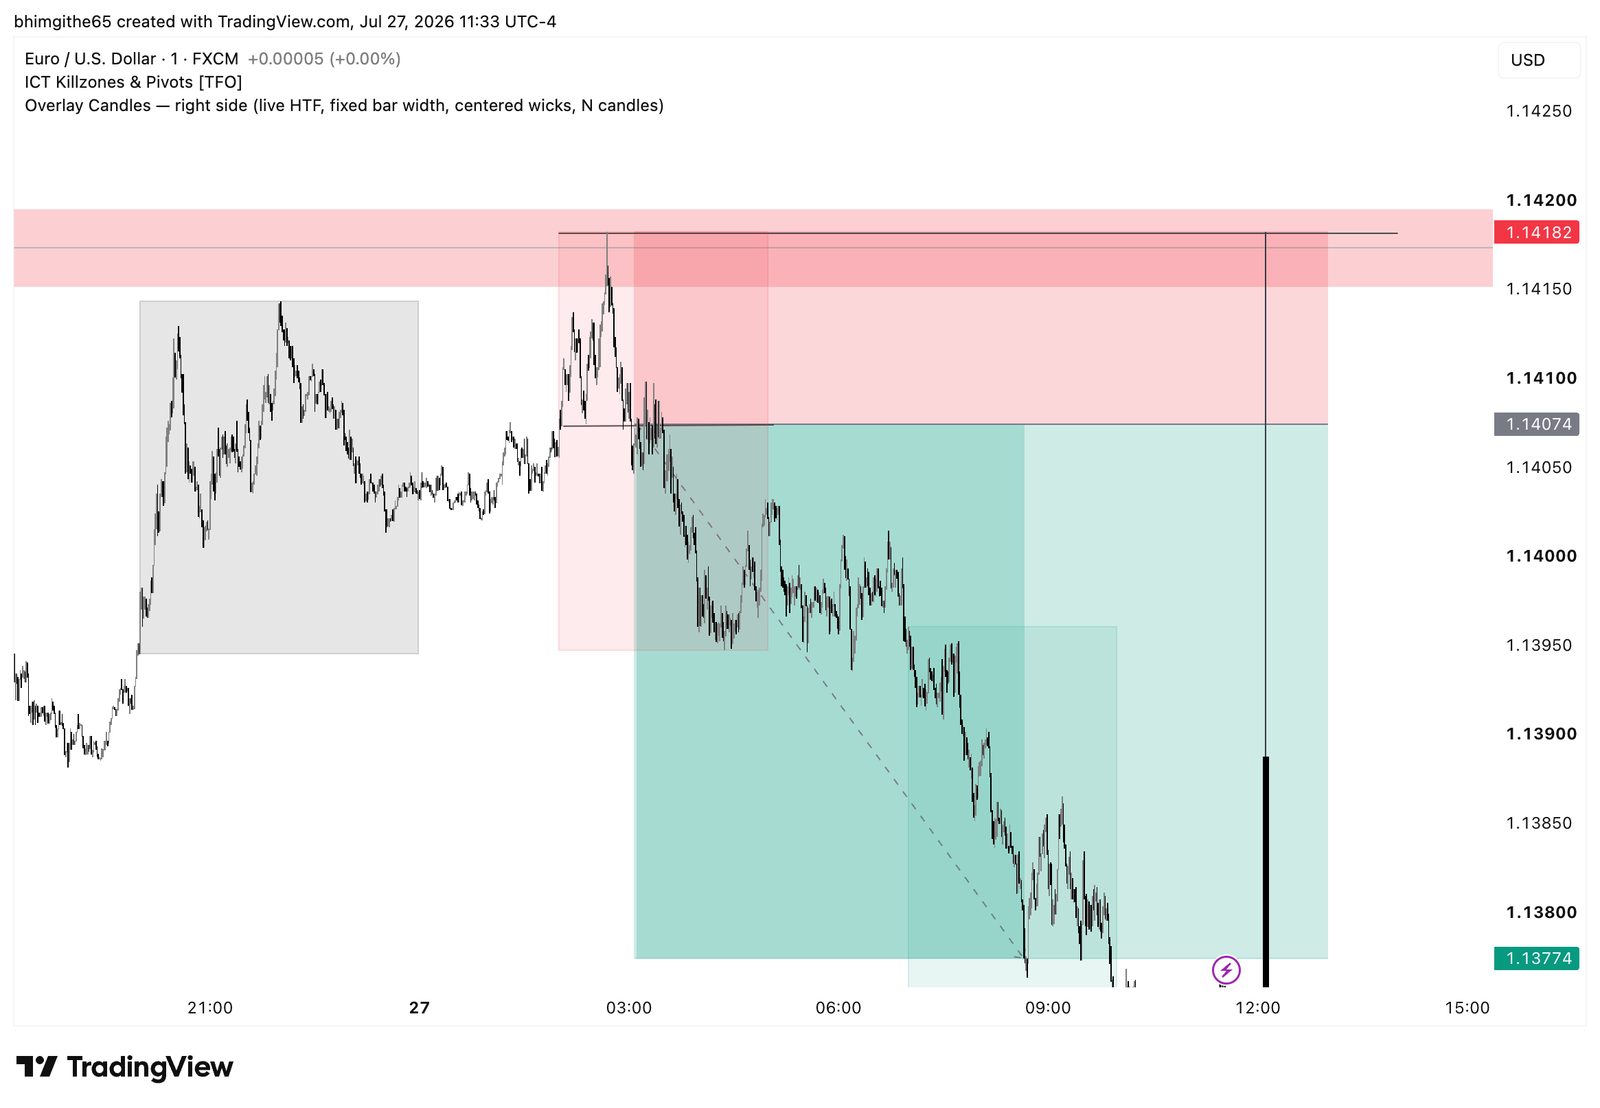
1-minute original chart: what it adds
The original one-minute TradingView screenshot is included here, unchanged. It is one of the three charts saved with this journal, not a generated market image. I use it to inspect the marked zones and the surrounding price action alongside my written notes. A screenshot saved after the event can show what happened around a level, but it cannot by itself prove exactly what I knew at entry or when I made each decision. The one-minute image is a close view; my note mentions a lower-timeframe shift, but I do not infer an exact candle time.
Entry, stop and the recorded result
My entry was 1.14074, with the stop at 1.14182 and the target and exit at 1.13774. The stop was 0.00108 above entry, or 10.8 pips, while the exit was 0.00300 below entry, or 30 pips. That works out to approximately 2.78R, consistent with the journal. I marked the trade as a win in the London session. Before it I recorded confidence, and afterward I recorded satisfaction, with no mistake tag.
What happened afterward
The journal says that a 1:3 target might also have been reachable. That is a retrospective idea, not the recorded result. The completed trade exited at 1.13774 and the actual risk-reward number was about 2.78R. The difference between 2.78 and 3 is small, but it still matters when I review a series of trades. I do not want to rewrite an exit simply because the chart later shows a little more movement.
The lesson I am keeping
My written lesson is to follow the plan and trust it. In practical terms for this case, I had a higher-timeframe area, waited for a reaction and lower-timeframe structure, and used a limit order after the candle closed. The charts were saved after the move and cannot prove every decision I made in real time. The notes are what connect the setup to the action. I can use this entry as a reference when comparing later trades where I entered early or ignored the planned sequence.
For my next review, I want to keep the same distinction between setup, execution and result. The entry, stop and exit fields tell me what I actually did. The annotated chart shows the price path I can study later. The lesson field tells me what I wanted to change or repeat. Keeping those three records separate helps me notice a weak process even after a win and a useful decision even after a loss. This is one historical trade, not a prediction about what EUR/USD will do next.
Related reading: the free trading journal template I use to keep a consistent record.
This is a retrospective trading journal for education, not a trade recommendation. The featured cover is editorial artwork; the TradingView images are the original screenshots.