This NDX100 trade journal covers a sell I took during the London session on July 16, 2026. I had a bearish higher-timeframe view, then watched price reject a fair value gap on the one-hour chart. I moved down through the lower timeframes to look for confirmation before entering at 29,403. My stop was 29,445.7, and I exited at 29,278.9. The journal records a 124-point win and an actual reward-to-risk result of 2.9R.
What matters most to me in this review is the sequence. I did not want to sell only because I expected the market to go down. I waited for price to reach the area I had identified, watched its reaction, and then looked for a market structure shift on the lower timeframe. My lesson afterward was simple: wait for the setup to activate, take the trade, and leave it alone.
The trade as I recorded it
The entry was 29,403, the stop loss was 29,445.7, and both the take-profit and exit fields were 29,278.9. That means the stop was 42.7 points above the entry and the exit was 124.1 points below it. The relationship between those distances is about 2.9R, matching the result saved in my journal. My template labels the movement field as pips, but for NDX100 I am describing the movement as index points.
I tagged this setup as an FVG retest and an FVG tap entry. Before the trade I marked myself confident, and afterward I marked myself satisfied. I did not record a mistake tag. These details do not make the setup right by themselves, but they help me compare the quality of my process and emotions across many journal entries instead of looking only at whether one trade won or lost.
Higher-timeframe context and the one-hour rejection
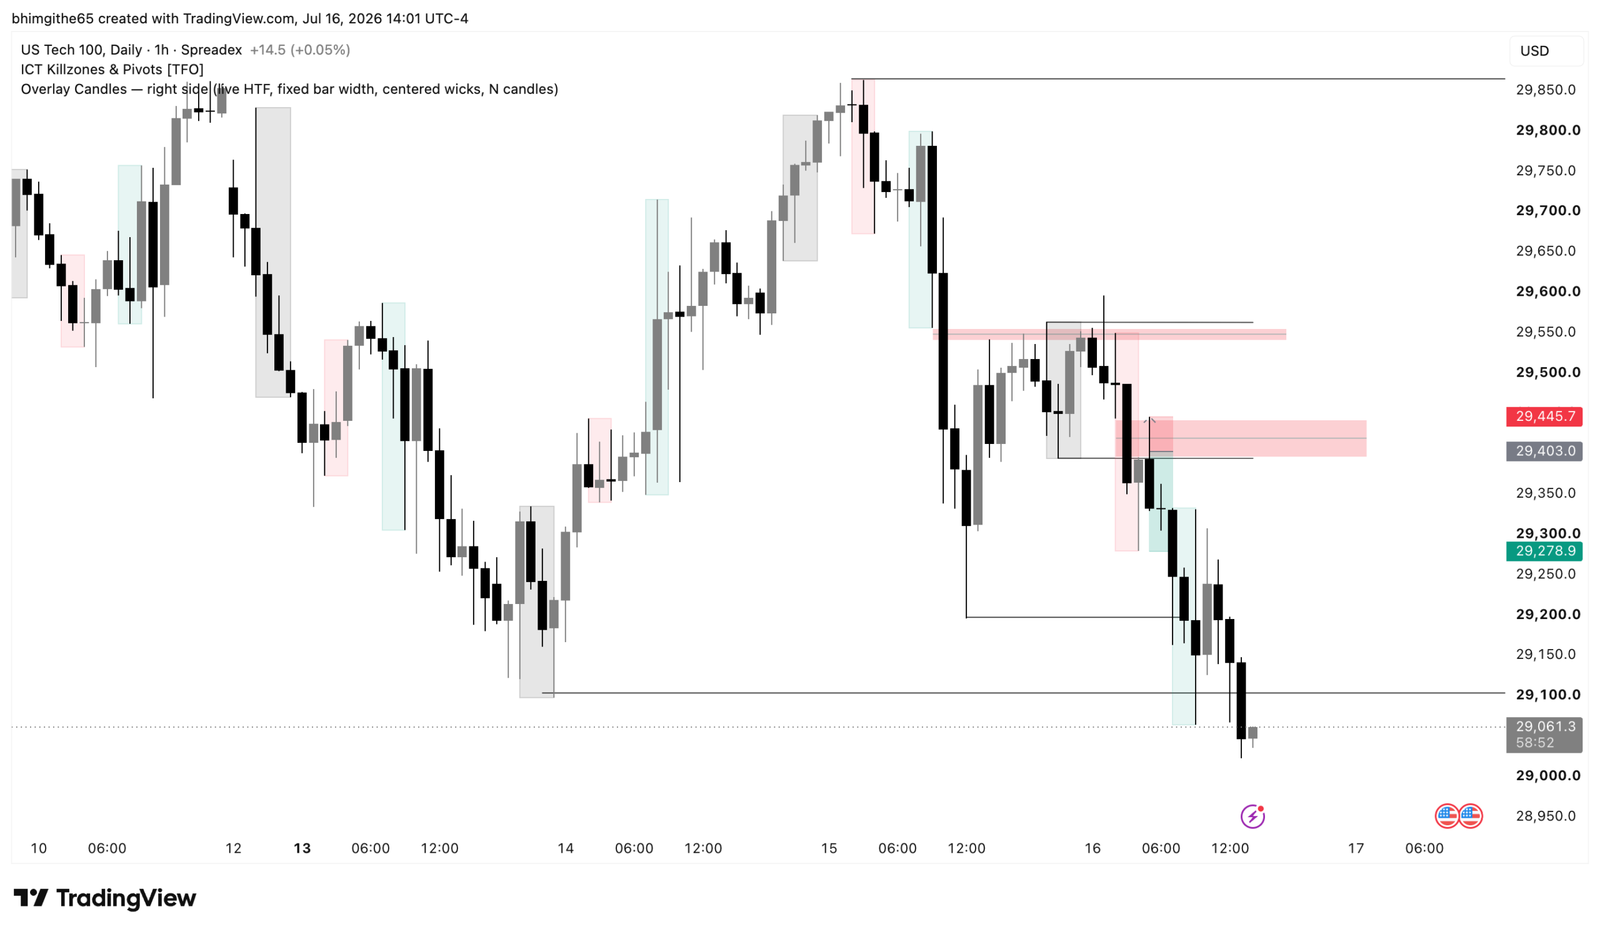
My written reason says the four-hour timeframe was bearish. I did not save a four-hour screenshot with this entry, so I am keeping that point as part of my written analysis rather than pretending there is chart evidence for it here. The widest original image I saved is the one-hour view. It shows the area around the trade and the marked sell position with its stop and target.
A fair value gap, often shortened to FVG, is an area traders use to describe an imbalance created by a fast price move. In my process, the label alone is not an entry signal. I watched how price behaved when it returned to the one-hour area. My journal says price rejected from that one-hour candle, which was the reason I moved to smaller timeframes and looked for a more precise confirmation.
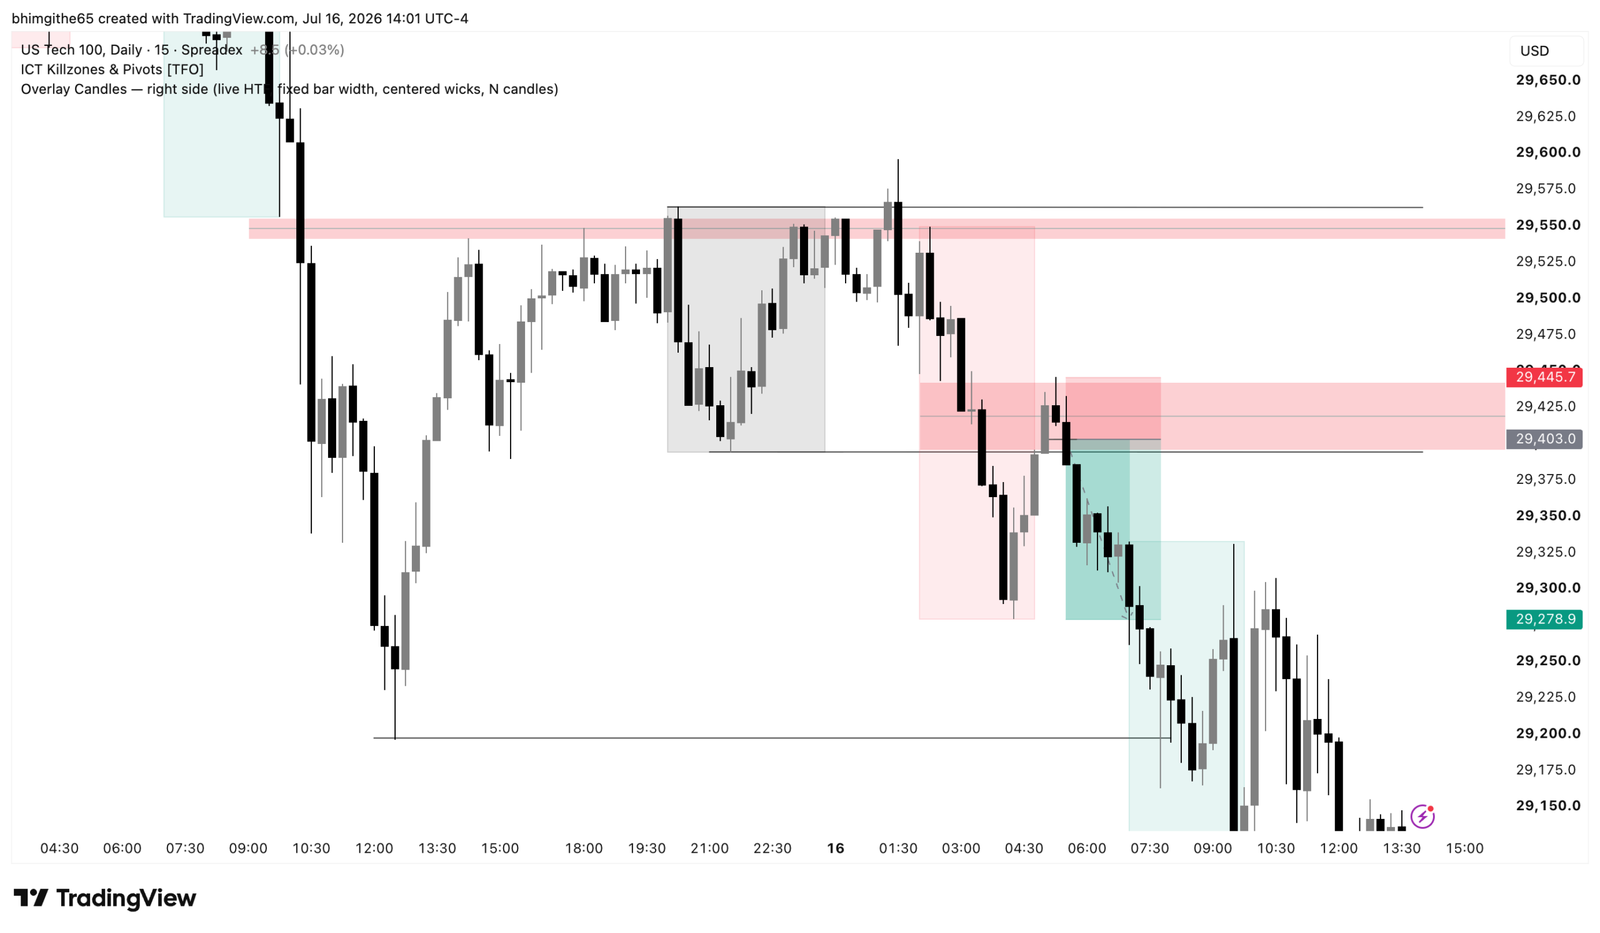
The 15-minute chart helped me refine the idea
After seeing the one-hour reaction, I moved to the 15-minute chart. This view gave me a closer look at the developing move and the surrounding price swings. The second screenshot preserves that 15-minute view together with the same entry, stop, and target levels. It helps connect the broad idea to the eventual execution without changing the facts saved in the journal.
My notes also say that I checked the five-minute timeframe, but there is no five-minute screenshot attached to this journal entry. I am not filling that gap with an invented signal. The available evidence is the one-hour, 15-minute, and one-minute images, while the five-minute check remains part of the written sequence I recorded at the time.
One-minute market structure shift and execution
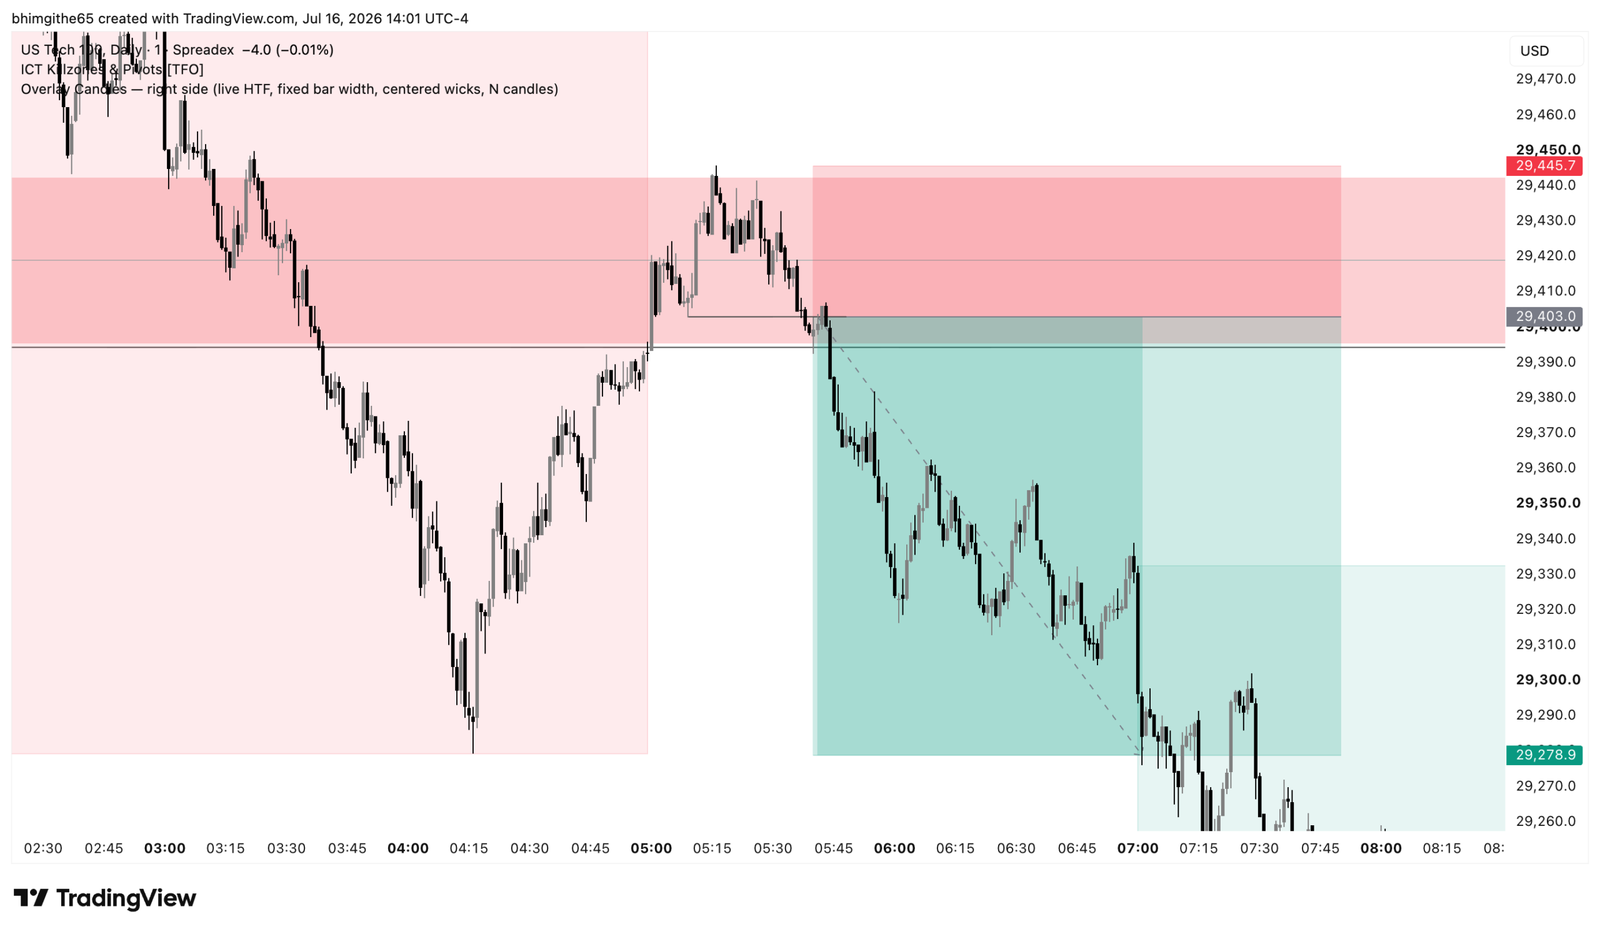
The final original screenshot is the one-minute chart. My journal says I saw a market structure shift there and then took the trade. A market structure shift means that the recent pattern of short-term highs and lows changes direction. In this case, I used it as lower-timeframe confirmation for the bearish idea that began with the higher-timeframe context and the one-hour rejection.
The one-minute view is useful for reviewing execution, but it can also contain more noise than a larger timeframe. That is why the earlier steps matter to my process. I was not using the smallest chart to create a completely new trade idea. I was using it to time an idea that had already developed from the bearish context and the reaction at the fair value gap.
The actual result and the later opportunity
The completed trade reached the recorded exit at 29,278.9 for approximately 2.9R. In my later-price note, I wrote that price continued lower. I also observed that a 1:3 target could have been reached if I had used one. That is useful hindsight for reviewing target placement, but it is separate from the result I actually recorded.
Keeping those numbers separate prevents me from improving a past result after seeing what happened next. This trade produced 2.9R in the journal. The possible 3R outcome is only a later observation. It may help me study whether my targets are consistent, but it does not mean every similar setup will continue or that holding longer is always the better decision.
The lesson I want to repeat
My main lesson was to wait for the setup, act when it activates, and then leave the trade alone. For this entry, the process moved from bearish higher-timeframe context to a one-hour FVG rejection, then to lower-timeframe observation and a one-minute structure shift. Writing the sequence down makes it easier to check whether I follow the same rules on future trades.
I also want to remember that confidence should come from following a defined process, not from assuming the outcome. This was one winning example with a 2.9R result. The value of the journal is the record of what I saw, where the idea would be invalidated, how I executed, and what I learned afterward. That gives me something specific to compare with the next trade instead of relying on memory.
Related reading: my previous NDX100 trade journal about an MSS and FVG retest.
This is a retrospective trading journal, not a recommendation to enter a trade. The featured cover is AI-generated editorial artwork; the three TradingView charts are the original journal screenshots.