
This GBP/USD trade journal covers my buy on July 30, 2026 during the New York session. This was a GBP/USD buy based on price moving higher and returning to a one-hour fair value gap. My journal says I entered as price tapped that area and aimed for the next four-hour candle high. The trade reached the recorded target. My lesson afterward was not to be afraid to follow my rules.
The recorded entry was 1.33759, the stop was 1.33620, and the target and exit were 1.34067. I recorded a win recorded as 2R. These are the completed trade facts; the later movement discussed below is a separate hindsight observation. I am sharing the original screenshots so the reasoning can be checked against the chart, while keeping the written journal as the source for what I actually decided.
Why I considered this GBP/USD setup
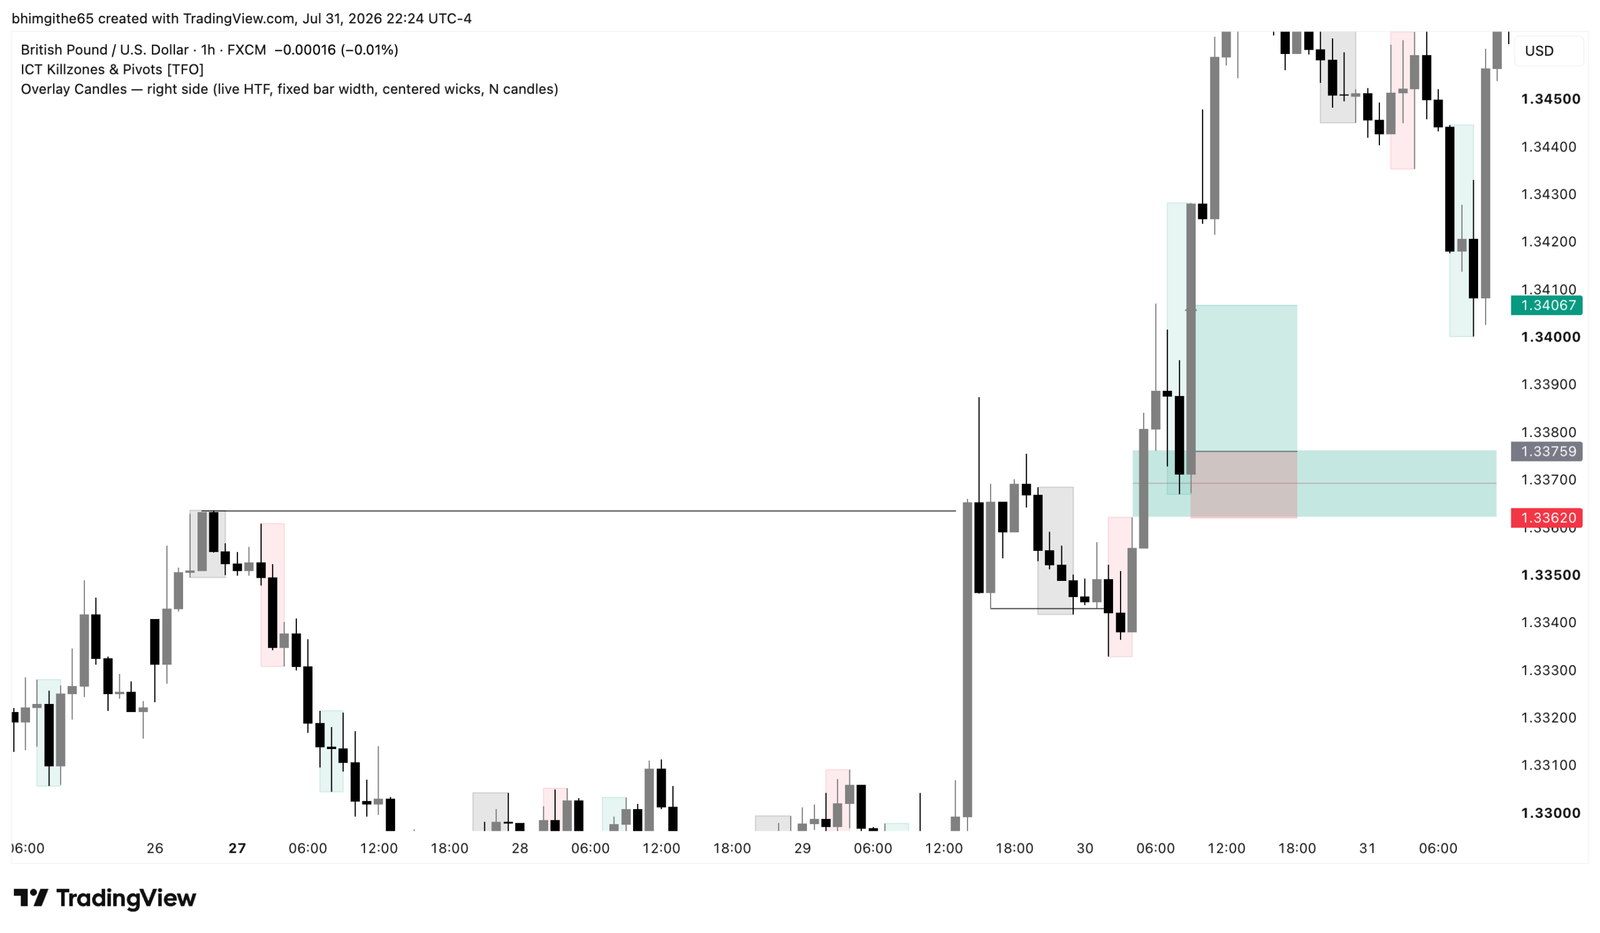
The one-hour gap was the area I wanted to watch for a continuation buy. In trading language a fair value gap is a zone left by a fast move; a retest can provide a structured place to assess whether the original direction still makes sense. It is not support by definition. I had a higher target in mind: the next four-hour candle high. That gave the idea both a reason for entry and a destination before I could judge the result in hindsight.
1-hour original chart: what it adds
The original one-hour TradingView screenshot is included here, unchanged. It is one of the three charts saved with this journal, not a generated market image. I use it to inspect the marked zones and the surrounding price action alongside my written notes. A screenshot saved after the event can show what happened around a level, but it cannot by itself prove exactly what I knew at entry or when I made each decision. The one-hour image corresponds to the fair value gap I cited.
15-minute original chart: what it adds
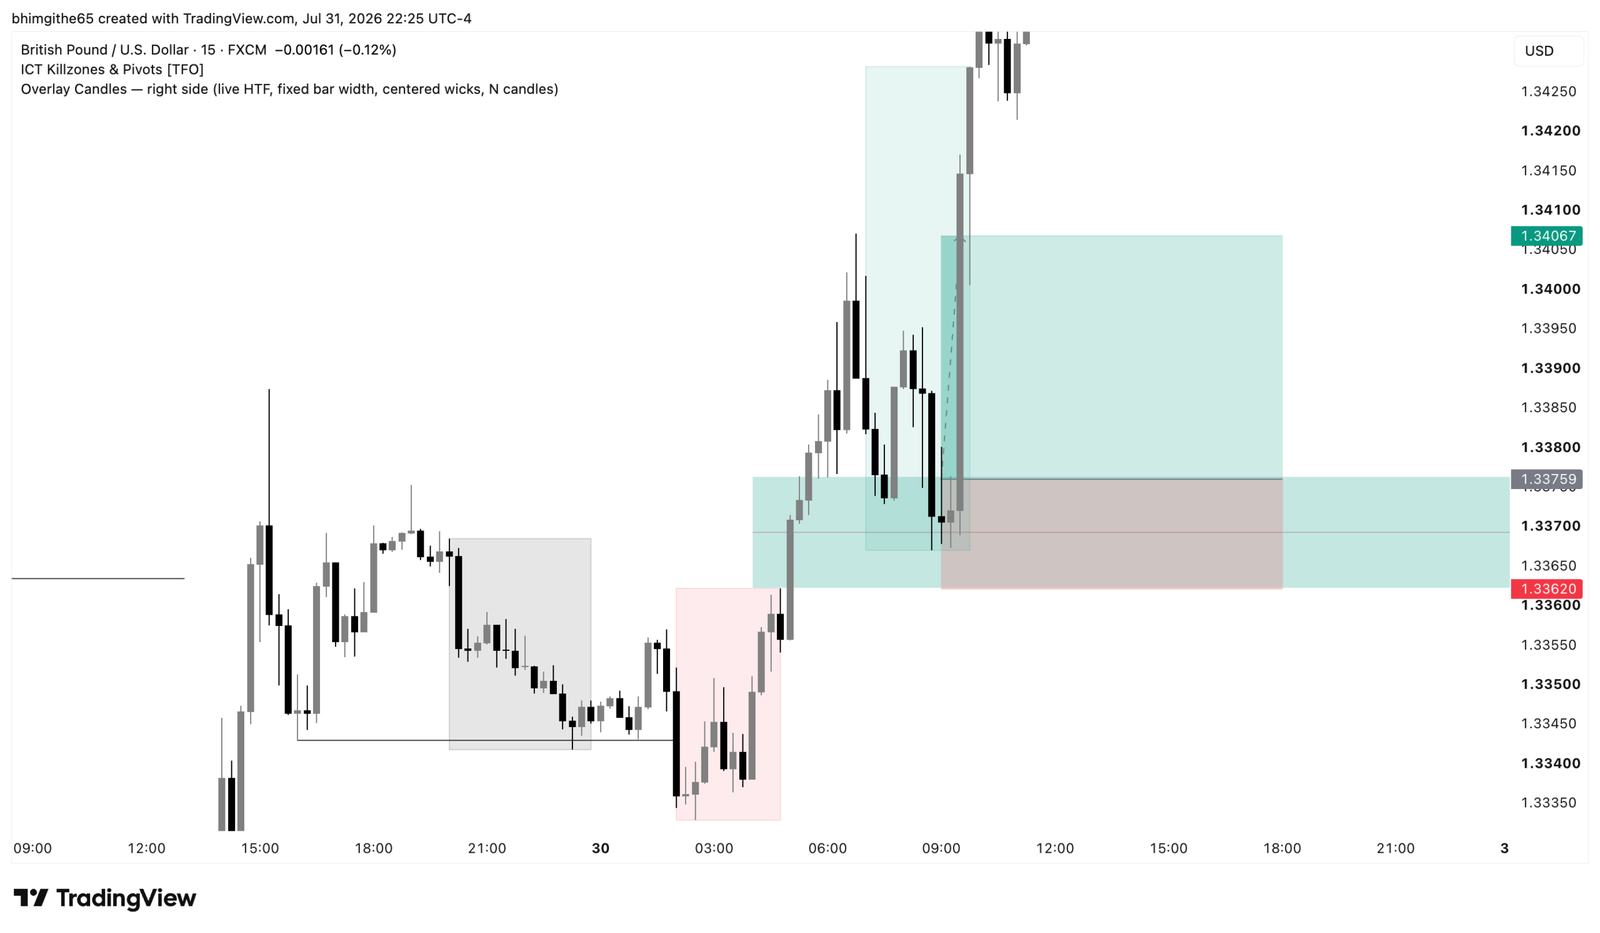
The original 15-minute TradingView screenshot is included here, unchanged. It is one of the three charts saved with this journal, not a generated market image. I use it to inspect the marked zones and the surrounding price action alongside my written notes. A screenshot saved after the event can show what happened around a level, but it cannot by itself prove exactly what I knew at entry or when I made each decision. The 15-minute image gives the intermediate retest view.
5-minute original chart: what it adds
The original five-minute TradingView screenshot is included here, unchanged. It is one of the three charts saved with this journal, not a generated market image. I use it to inspect the marked zones and the surrounding price action alongside my written notes. A screenshot saved after the event can show what happened around a level, but it cannot by itself prove exactly what I knew at entry or when I made each decision. The five-minute image shows the closer move around the marked buy.
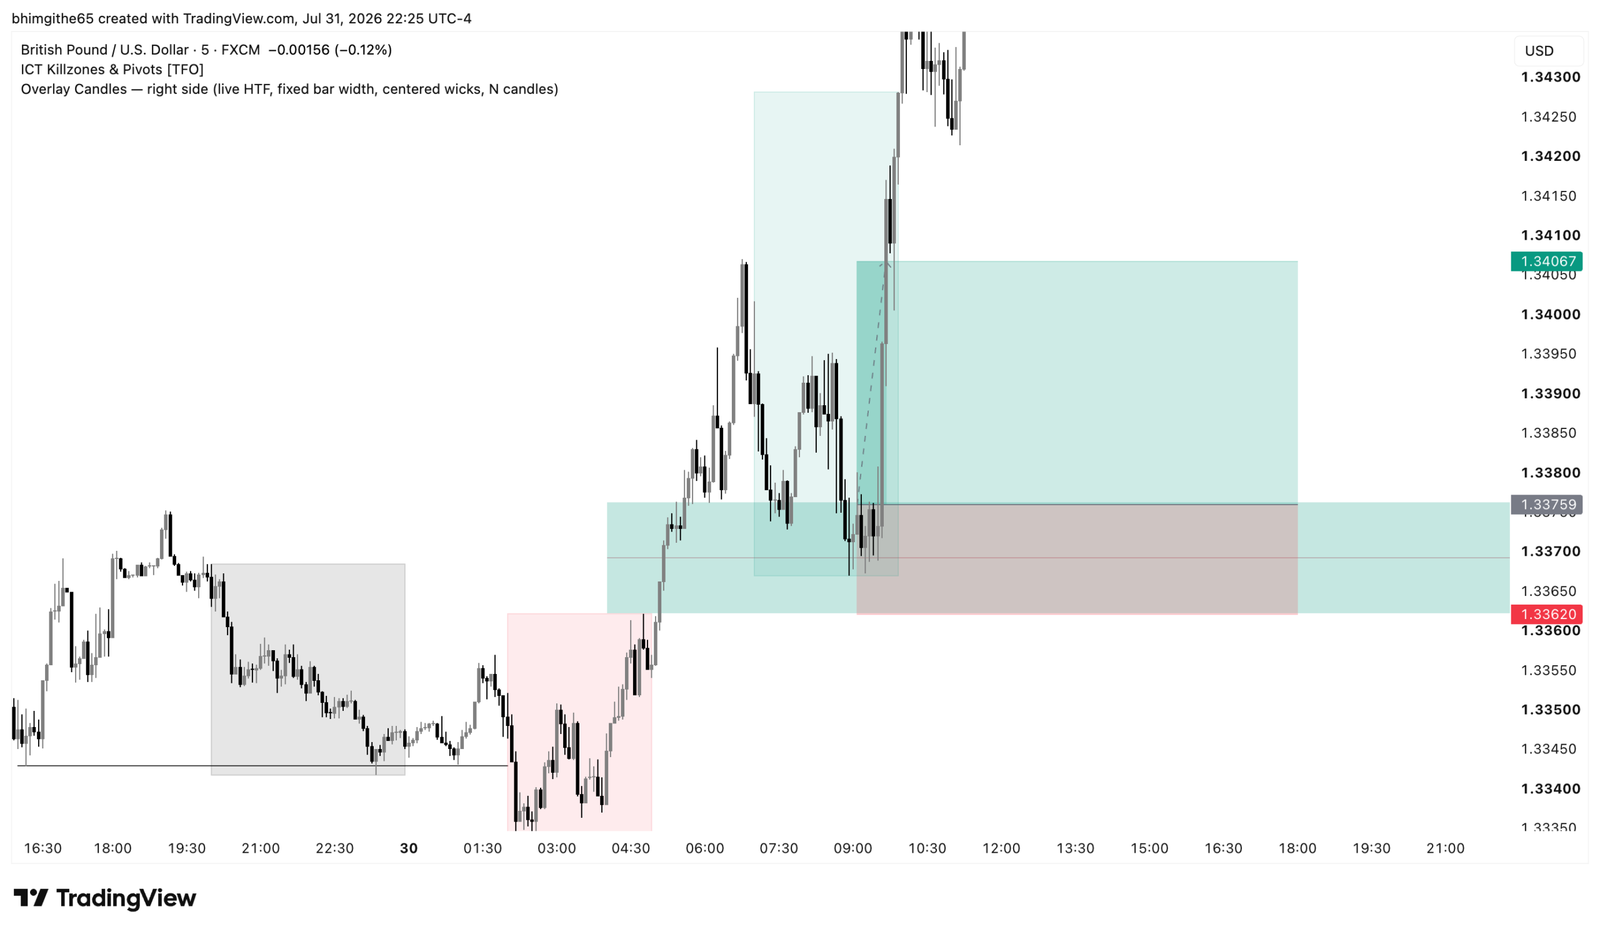
Entry, stop and the recorded result
I bought at 1.33759 with a stop at 1.33620 and a target and exit at 1.34067. That is 13.9 pips of distance to the stop and 30.8 pips from entry to recorded exit. The ratio from those displayed prices is a little above 2R; my journal records 2R, so I use roughly 2R here. The trade was a win in the New York session. I recorded confusion before it and satisfaction afterward, with no mistake tag.
What happened afterward
Price kept rising after my exit. In the later-price field I wrote that a 1:3 target, or even more, might have been available. That is a hindsight observation. I realized the result at 1.34067, not at a later level. It is useful to study whether my take-profit was conservative, but there is no need to manufacture extra return to make the journal look better. The original screenshots show the continuing bullish move and the marked trade area.
The lesson I am keeping
My lesson was to trust the rules even when I felt uncertain. That does not mean every retest deserves a buy. In this entry the one-hour area, the upward movement and the four-hour high target gave me a coherent plan. The trade gave me a positive outcome, but I want to remember the process rather than chase a larger theoretical result. When I compare this with losing entries, I will look at whether the trigger, invalidation and target were all defined before the trade.
For my next review, I want to keep the same distinction between setup, execution and result. The entry, stop and exit fields tell me what I actually did. The annotated chart shows the price path I can study later. The lesson field tells me what I wanted to change or repeat. Keeping those three records separate helps me notice a weak process even after a win and a useful decision even after a loss. This is one historical trade, not a prediction about what GBP/USD will do next.
Related reading: the free trading journal template I use to keep a consistent record.
This is a retrospective trading journal for education, not a trade recommendation. The featured cover is editorial artwork; the TradingView images are the original screenshots.